Trend-following strategy: Weekend Trend Trader

Weekend Trend Trader is a proven trend-following strategy developed by Nick Radge, who shares his insights in the best-selling book Unholy Grails. The strategy is designed to identify stocks with strong positive momentum and capitalize on continued gains – all with a simple methodology that only requires weekly rebalancing. Perfect for those looking to combine efficiency with profitability!
I have previously described the strategy in an episode of Marknadspulsen, but now it is time to bring it up again. When the Stockholm Stock Exchange is once again trading above its 200-day moving average, the strategy becomes even more relevant. Thanks to a smart trend filter, it avoids new trades when the market is below MA(200), giving you an extra level of protection in uncertain times.
You don't need to analyze the market yourself or look for signals. On our platform you get clear and ready-made signals for both buy and sell, based on the principles of the strategy. This makes it easy for you to follow the strategy and act with confidence.
Are you ready to take your investing to the next level with a strategy that combines simplicity, discipline, and the potential for long-term success? Weekend Trend Trader shows you the way!
Backtest: Weekend Trend Trader
We test the strategy on the companies in OMX Large and Mid Cap. For the sake of simplicity, we have not taken into account survivorship bias – that is, some companies may have disappeared from the stock exchange over time. It would be more accurate to include this if the goal was to accurately reflect history. But now it is more about getting a feel for how different methods for stop-loss and position sizes affect the result.
It is important not to take backtest results too literally, and we should be aware that most tests tend to be overoptimized. It is easy to use too many adjustments until we get impressive numbers, but data mining will not help us in the future.
The backtest below should therefore be seen as a rough guide - it can give us insights into what has historically worked well or poorly and thus which principles we can benefit from.
Concept
- All trends begin with breakouts
- Ride winners and stop losers
Conditions in strategy
- Long-only
- Breakout to 20-week high
- 30-Week Rate of Change over 20
- OMX All-Share Index must be listed above MA(200) to take new trades
- Max 20 companies in the portfolio (equal weighting)
- Trailing stop loss of 40%. In negative market phase, stop loss is moved up to 20%.
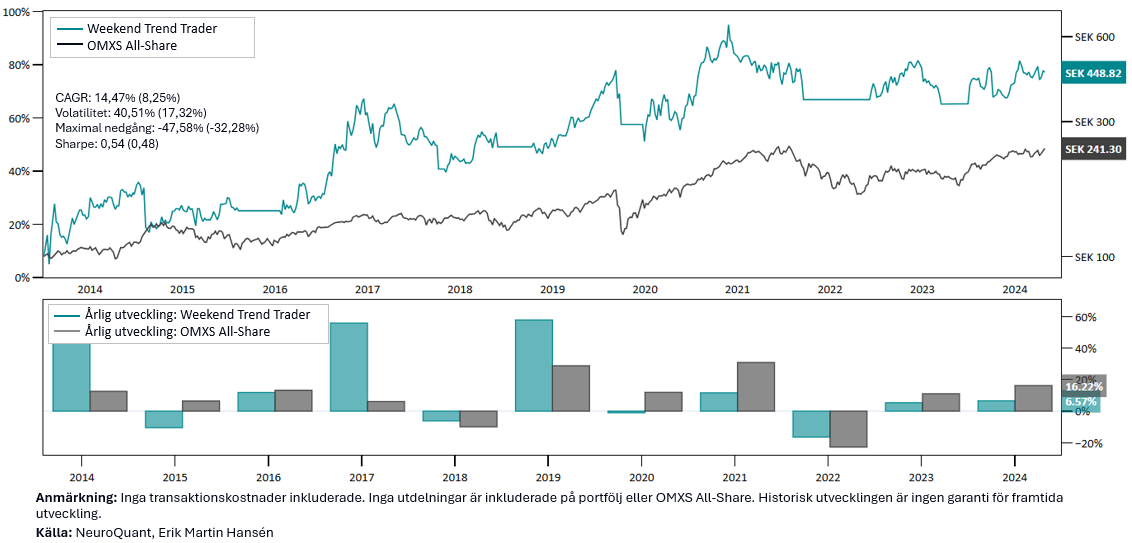
Result: The strategy has delivered good returns, but the volatility has been more than twice that of the stock market. In addition, the maximum decline has been unacceptably large, which means that the risk in the strategy needs to be evaluated and possibly adjusted.
- CAGR: 14,47%
- Volatility: 40.51%
- Maximum decline: -47.58%
- Sharpe: 0,54
Let's try some different variations
We should strive to avoid over-optimization, but we can cautiously test variants that are logical and proven to be robust. For example, we can adjust stop-loss levels and position sizes based on stock volatility.
Below we see some different variations of the Weekend Trend Trader.
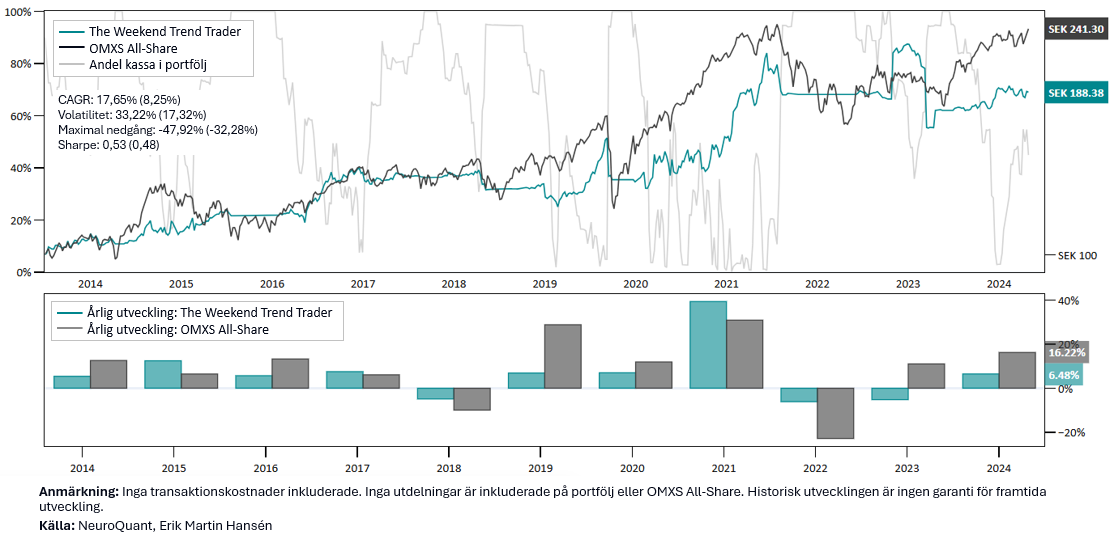
The statistics above and the graph below show that a too tight stop loss significantly impairs the strategy. To capture larger and longer-term trends, we need to give the stocks enough room to move. If we often get stuffed by the market's small movements (noise), it will be difficult to achieve profitability. If we use tight stop losses, we need to be more active in trading, but what we are doing now is testing a weekly strategy that will capture larger trends.
A better version of Weekend Trend Trader
I like the idea of adjusting position sizes based on volatility. Volatility may not always be the best measure of risk, but we can think of it as a “currency” – with as little volatility as possible, we want to buy as much return as possible. By adjusting portfolio weights according to volatility, we allow each holding to have an equal theoretical impact on the portfolio’s performance.
Instead of weighting the companies equally, we now adjust the position sizes depending on how much the shares usually fluctuate. We can also use a stop loss that takes into account how much the shares usually fluctuate. In this case, we only sell if the stock has fallen more than 10 times a “normal” daily movement. This is calculated using the 20-day Average True Range – an indicator that can be added to a price chart.
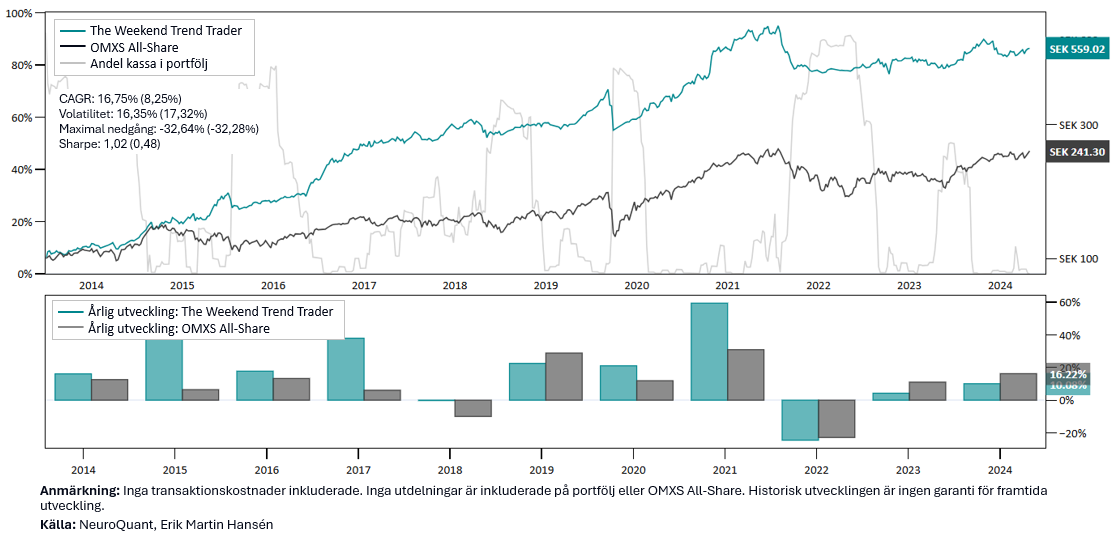
Result: The backtest shows a significantly improved risk-adjusted return compared to the first version, which uses equal-weighted positions and a fixed stop-loss of 40%. The updated strategy has now achieved a development with significantly lower volatility and a smaller maximum drawdown. The absolute return has also improved. In recent years, the development has been weak, but keep in mind that it has been a challenging period for this type of strategy.
- CAGR: 16,75%
- Volatility: 16.35%
- Maximum decline: -32.64%
- Sharpe: 1,02
The platform gives you clear decisions
On the platform we can follow breakout signals for trend-following strategies. There is no magic in these signals and we should not try to search for exact parameters that have worked historically. Over-optimizing something by chance and coincidence only helps someone who wants to “sell” a strategy, but will not help our returns in the future. The important thing in the strategy is not entry but diversification with multiple holdings, risk management and volatility-adjusted portfolio weights.
We can see breakout signals in our watchlists or on the Trend Following (premium) page.
Here's how we find the breakout signals:
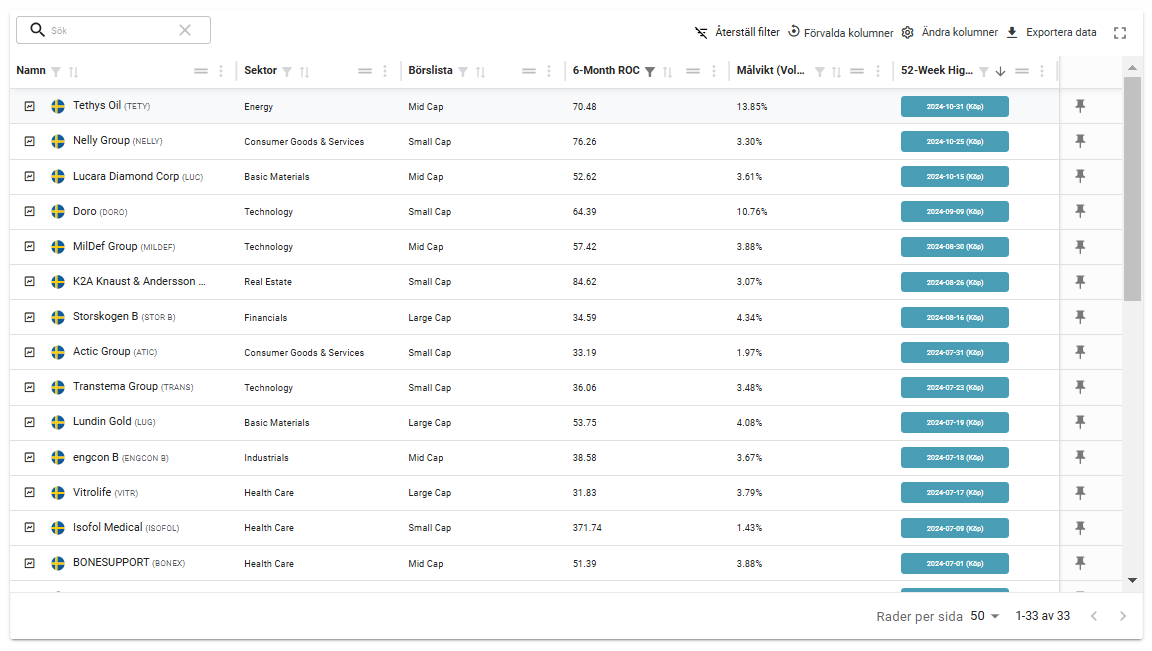
- Go to the Trend Following page
- Go to the Outbreak Signals tab
- Click Change Columns
- Add 52-Week High Breakout from the Trend & Momentum category
- Add 3 or 6 Month Rate of Change (proxy for 20-Week ROC)
- Add portfolio weights from the Position and Risk Management category. Suggested 10, 15 or 20 bps depending on the size you prefer. 10 bps is lower risk in each holding, which will lead to more companies in the portfolio.
- Click the Save icon to keep the columns in the table.
Create a ranking of the companies
Now that we have the columns in place to identify buy signals, to create our rankings, we start by sorting the table by 52-week high. Then we filter to only show stocks with a Rate of Change above 30.
Put the strategy into motion
According to the principles of Weekend Trend Trader, we review the signals over the weekend or on Monday morning before the stock market opens. First, we review whether any holdings need to be sold and then add new, exciting companies from the top of the table. The purchase amount for each new holding is smoothly controlled by the target weight column, making the process simple and efficient.
Choosing the right selling rules is a key to success. Find a method that suits your strategy and avoid too tight stop-losses that can create unnecessary trades. Remember that consistency is key! For those of you working with multiple trend strategies, there is also the opportunity to diversify further by varying your exit methods.
With this strategy, you have the tools to take control of your investments and follow trends in a smart and structured way. The platform gives you the support you need to act decisively and successfully.
I hope this has given you both inspiration and the insight to take your trend following to the next level. Now it’s time to put your plan into action – the future awaits you!


