S&P 500 below MA12 – a signal that has often been better than the experts


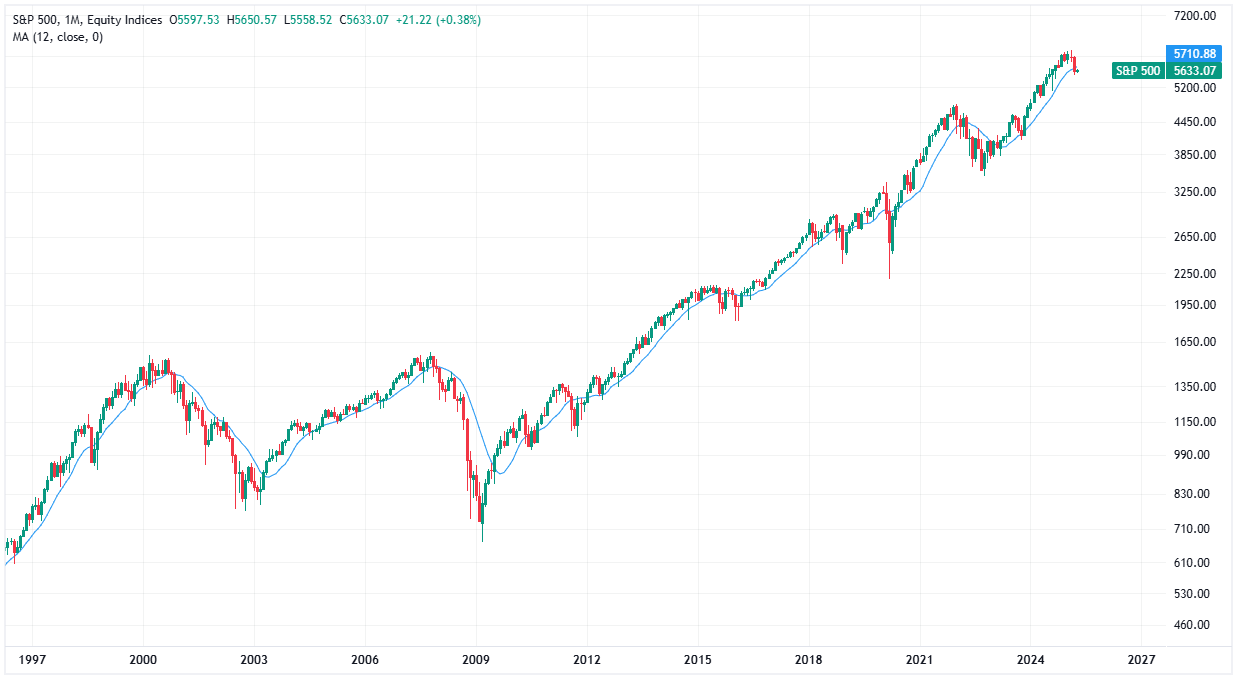
The S&P 500 has now closed below its 12-month moving average, a signal that many see as a simple but powerful trend indicator. Throughout history, it has often been a warning flag, but as always, the question is: is this the start of a longer period of weakness or just noise in a volatile market? In a world where forecasts constantly fail, these kinds of simple trend rules have proven to be surprisingly accurate – at least in this index.
What is the 12-month moving average (MA12)?
The 12-month moving average (MA12) is simply the average price of the S&P 500 over the past 12 months. Many systematic strategies use this average as a filter rule. Historically, it has often served as a simple trend indicator: when the index is above the MA12, the stock market tends to do well, and when it is below, future returns have been worse.
No guarantee – but a signal to take seriously
A break below the MA12 does not mean that a bear market is guaranteed. It is an indication that risk is increasing, but the market is not predictable. Sometimes a major decline follows, sometimes the market quickly turns back up.
It is also important to understand that long-term strategies using the MA12 are usually not based on hitting the top perfectly. Rather, they try to avoid the really long and deep bear markets – even if that means sometimes selling and then buying back higher.
Why has the signal worked so well on the S&P 500?
The interesting thing about the S&P 500 and the 12-month moving average is that this simple trend-following signal has actually worked surprisingly well historically. It’s not because of magic or that the market always “respects” the average, but because the S&P 500 has had a tendency over the years to enter clear and sometimes long-lasting trends. Many bear and bull markets have been just that – prolonged and powerful – which is exactly what a trend-following model needs to work.
A signal that beat most forecasts
In fact, these types of simple models have often been shown to work better than most forecasts and expert opinions about the future. While analysts and economists have often failed to pinpoint peaks and troughs, a method as simple as tracking whether an index closes above or below its 12-month moving average has given investors a framework to avoid the worst bear markets and ride the bigger rallies.
It's not a perfect indicator – there are plenty of false signals along the way – but over time it has proven more useful than most attempts to predict exactly what the stock market will do next.
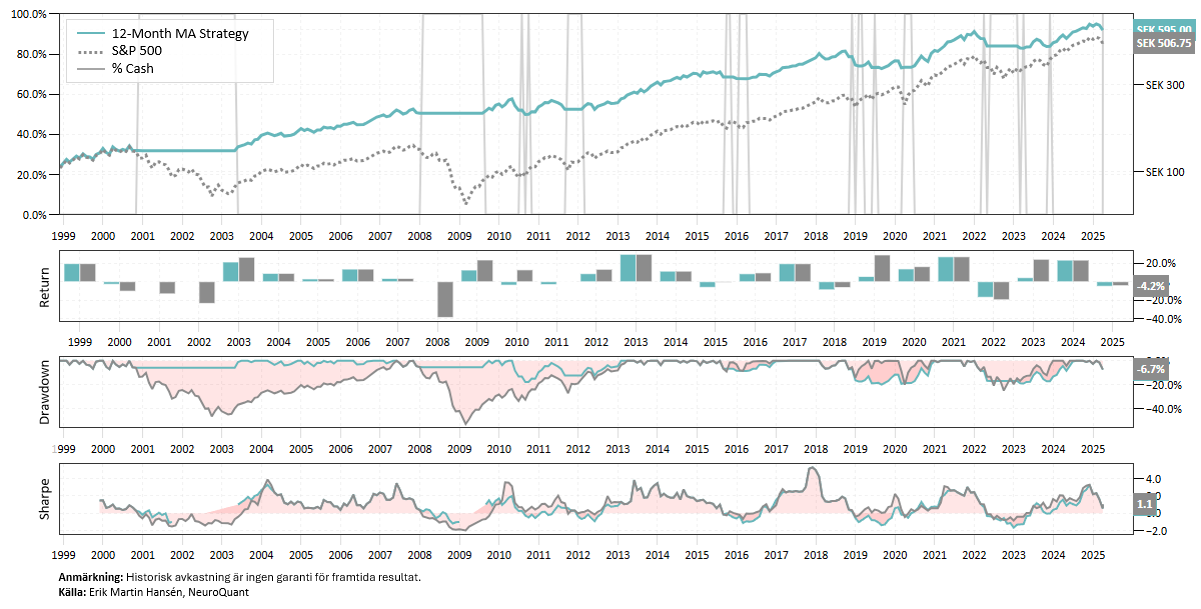
Backtest on 12-month moving average
Thanks to the strategy being out of the stock market during longer bear markets, the strategy has had a good return. A high CAGR and significantly lower volatility and maximum drawdown than buy-and-hold in the S&P 500. The percentage of winning trades has been 62.5% and the strategy has had a position open for an average of 310 days. Time in the market has been 75%.
Now, this simple strategy suggests staying completely outside the S&P 500.