The Buffett Indicator: A Misunderstood Bat for Doomsday Prophets

Some graphs get huge traction – not because they are particularly insightful, but because they look like they are.
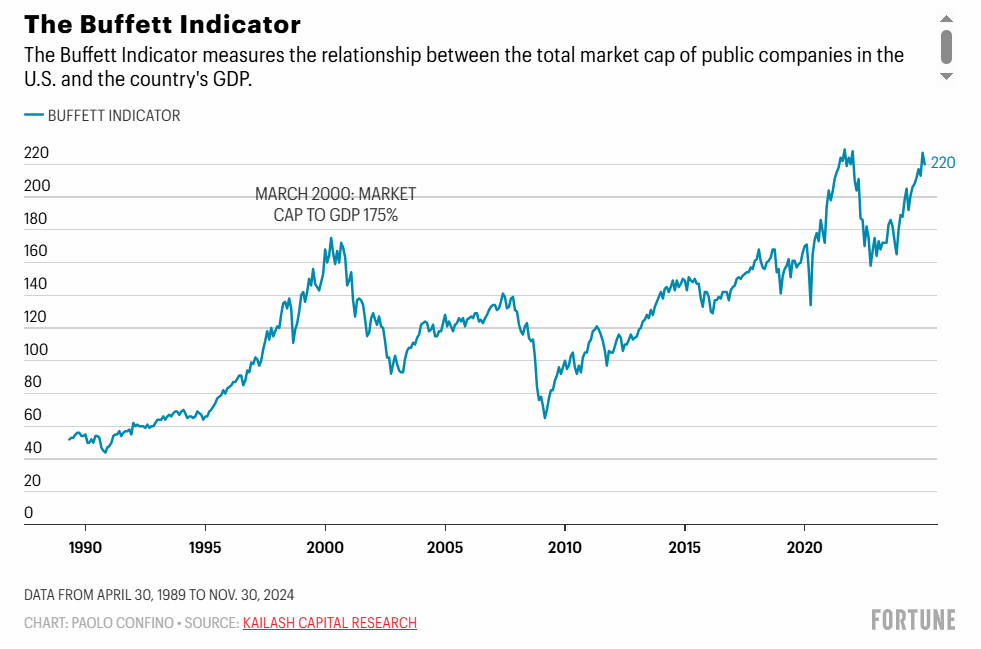
One such example is the classic relationship between market capitalization and GDP, often called The Buffett indicator.
It sounds logical: “If the market value is much higher than GDP, then it must be overvalued?”
But that is precisely what makes the indicator dangerous – it is intuitive, but misleading.
Where the name actually comes from
The name comes from a single quote in Fortune Magazine in 2001, where Warren Buffett called the indicator “probably the best single measure of where valuations stand at any given moment.” It was enough for the media to rename the entire indicator after him.
But he never used it in his annual letters or as an active part of his decisions. It was a general statement, which lived on far outside its context.
Since then, the indicator has become a favorite among permabears, doomsday prophets, and journalists who want to illustrate that “the market is overvalued.” It’s easy to understand, looks dramatic on charts – and is therefore a pleasure to click on.
And it's not just on social media that the indicator is spreading. It appears in financial media and even in reports from major investment banks – especially when the stock market is expensive and analysts are pressured to produce content. The fact that the signal is random sometimes matters less, as long as it looks like analysis.

The problems with the Buffett indicator are several:
- It ignores globalization
Companies like Apple and Microsoft get most of their revenue outside the U.S. GDP only measures domestic production, which makes the comparison skewed. - The stock market looks ahead – GDP looks back
Market value is based on expectations about the future. GDP shows what has already happened. Comparing them as if they are moving in sync is like reading the annual report backwards. - The structure of the economy has changed
In the past, industrial companies dominated. Today, tech, services, and intangible assets dominate. This allows market capitalization to grow without GDP necessarily following suit. - The market structure has changed
There are fewer but larger listed companies today, which means that today's market capitalization cannot be directly compared to historical levels.
A noisy measure – but a grateful bat
The indicator is often used to “warn” of downturns. But even if it were to show a record high value, it does not say anything about when a downturn will actually come. It can take several years. And in the meantime, the upturn is often missed.
Conclusion
The Buffett indicator may have made sense 40 years ago. But today it paints a distorted picture of the market. It doesn’t reflect how companies make money in a global economy, and it ignores the fact that the stock market values the future, not the present. In practice, it often says more about the person sharing the graph – than about the market.