Analysis and signals – the basis for smart investment decisions

We offer a unique combination of analysis and signals to help you navigate the market.

content-image

Get both actionable insights and clear signals for smarter investing

We combine in-depth analysis with clear, systematic signals to help you make informed investment decisions

  • Analysis: Our in-depth analyses provide clear insights into market movements and the factors driving them. By analyzing trends, sectors and market behaviors, you can make more informed decisions and develop your own investment strategy.
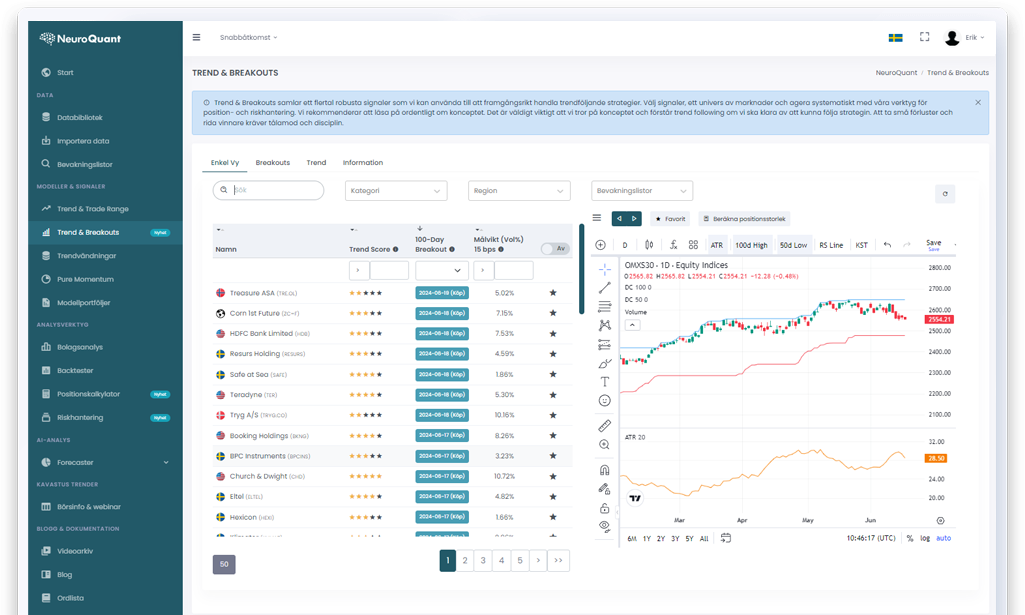
  • Signals: With our objective and concrete signals, you get clear indications of when it's time to act. Our signals built on robust, systematic strategies, eliminate emotional bias and uncertainty, allowing you to focus on key market opportunities.

Together, the analysis and signals give you both the understanding and tools you need to succeed as an investor. Whether you are a beginner or an experienced investor, our service offers a new and different way to make your investment decisions – without unnecessary noise.

Get the advantage that traditional investors miss – start today!

Try it free for 30 days

Open a free demo account to explore our in-depth analyses and systematic signals—experience the power of data-driven investing today.

Open demo account

Frequently asked questions about our analysis work

We do not use the subjective technical analysis that many people consider technical analysis, such as support and resistance levels, formations, head and shoulders patterns, wave theories, Gann, magic numbers, etc. There is a reason why successful market participants ignore these methods. We focus on things that can be quantified.

We study fundamentals such as earnings development, profitability and valuation multiples, because changes in fundamentals affect the long-term price trend of the share price. We do not take into account opinions or narratives about fundamentals. In some strategies we combine fundamentals with price development, while in other strategies, such as momentum and trend, we use price development alone. For example, we offer the Value & Momentum and Volatility & Quality model portfolios that combine price development with fundamentals.

Our studies show that changes in growth and inflation affect how investors view markets, factor styles and sectors. The important thing is not whether the macro data is good or bad, but whether the data is improving or deteriorating. If we can predict changes in the data, we can predict a lot of other things. However, making forecasts is very difficult. That said, we see great value in assessing the macro environment we are in at the moment.

Elliott Wave can mean different things to different players. Wave 5 can be interpreted as wave 3 and vice versa. We want to avoid looking for patterns and formations in graphs. We have a tendency to see what we want to see and not what actually is. Due to cognitive biases, it is easy to get optical illusions.

Yes, in the platform we have a data library and graphing tools where you can do your own analysis. The premium package also includes several pages where you get access to a wealth of unique signals we have developed for different types of strategies, such as momentum, trend following and equilibrium oscillation.

The analysis material is sent out by email and published within our analysis platform.

Yes, we have many different screeners where we filter out stocks and markets based on the conditions that we think work.

Systematic strategies are methods that are based on fixed rules rather than subjective decisions. This eliminates emotional factors from the investment process. We work with concepts that have worked historically and that we believe will continue to work. What works in the market is not what is easy or fun. With the help of systematic strategies, we can go against our emotions and trade with an edge.