Don’t be fooled by technical analysis

Technical analysis is very popular and often the first method that beginners encounter when they start trading actively, especially if they focus on short-term trading. With simple graphs and clear patterns, technical analysis seems to promise quick results and easy profits – especially when so-called “gurus” on social media highlight their successes by trading via the graph.
It is important not to be fooled by technical analysis – something many of us have done.
I am a licensed technical analyst through IFTA (International Federation of Technical Analysts) and have been on the board of STAF (Scandinavian Association of Technical Analysts) for ten years. This experience has given me a deep understanding of technical analysis and price dynamics.
What is technical analysis?
Technical analysis can mean different things to different players and it is important to distinguish between subjective technical analysis where we look for patterns to predict the future and objective technical analysis which can be quantified. In this post we focus on the subjective analysis.
Many people use technical analysis to predict price movements based on historical patterns and formations in stock prices. The basic idea is that all available factors are already priced into the market and that human behavioral patterns – such as trends, support levels and resistance – can provide guidance about the future. How sustainable are these methods when formations in price charts can be completely random?
Visual simplicity is appealing
Many people quickly become convinced that they can predict the market by identifying technical patterns, and the visual simplicity of the method makes it particularly appealing. However, there is a big risk here: technical analysis provides a false sense of security, and its popularity can sometimes be due more to its simplicity than its effectiveness.
We should not be fooled by the subjective technical analysis where we look for patterns in graphs. This simplified view of the market can be bought at a high price. Without a deeper understanding of what actually drives the price, one risks relying on superficially analyzed signals and subjective interpretations, which rarely hold up in the long run. Here is a critical examination of technical analysis, and why for many it represents a risk rather than an aid on the path to long-term success.
Subjective interpretations of formations
It's easy to get optical illusions when we study graphs. We see what we want to see, not what actually is. The brain is very good at finding patterns.
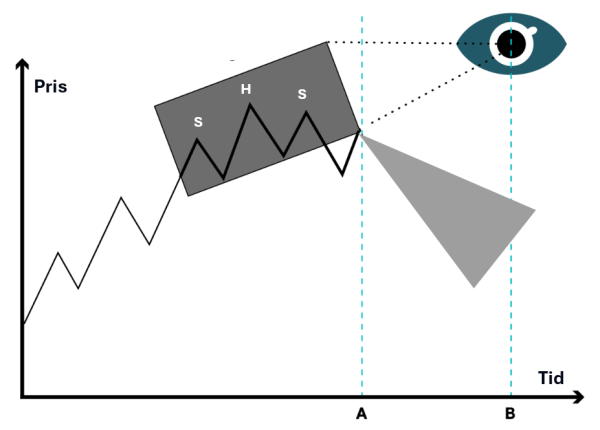
The graph below would be interpreted by most as negative for future price development. It looks like a head-shoulder formation according to the technical analysis.
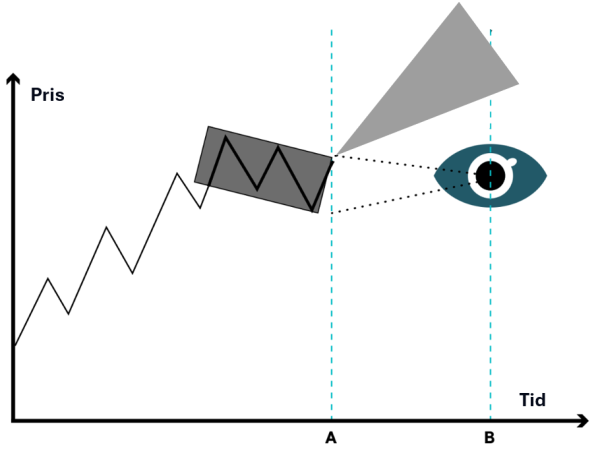
 If we study the graph below, we may make a positive interpretation of future price developments based on the fact that we have identified a bull flag according to the technical analysis.
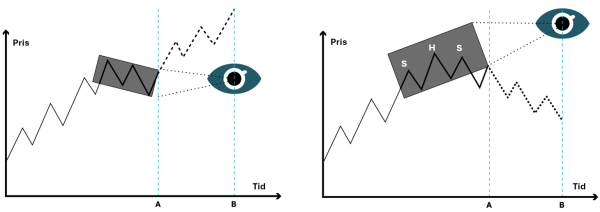
If we study both graphs below, we can see that we have made different interpretations of the same price graph. Whether we see the graph as a head and shoulders formation or a bull flag is in the eye of the beholder and depends on what we are looking for.
The Weaknesses of Technical Analysis
-
- Historical patterns as a guide for the future: One of the biggest weaknesses of technical analysis is its reliance on historical price movements. Just because a certain pattern has repeated itself in the past does not mean it will happen again. This pattern can often be random. This reliance on historical patterns as a guide is problematic, especially in a market that is influenced by fundamental factors and unpredictable events.
- Subjectivity and interpretation: Technical formations, trend lines and interpretations of indicators leave a lot of room for interpretation. Is it a “head and shoulders” or a “bull flag”? This subjectivity means that two technical analysts can draw completely different conclusions from the same chart.
- Self-fulfilling prophecy: Another problematic aspect is the idea of self-fulfilling prophecies. Some technical patterns only work because enough traders believe in them and act in the same direction. This means that technical analysis can in some cases create the price movements it is trying to predict. This is an unstable foundation, and not something we want to rely on in the long term. Some markets such as the bond market are driven by fundamentals and larger institutions, which means the self-fulfilling prophecy will be significantly lower than, for example, bitcoin where more players use technical analysis.
- Lack of critical thinking: One of the biggest risks of technical analysis is the lack of critical thinking it can create. Many beginners get stuck in a pattern of thinking and do not take into account other factors. Instead of questioning and understanding what actually drives the market price, they rely on past patterns to hold in the future. Many technical analysis “gurus” promote the method without highlighting its weaknesses, which can create false expectations. Even experienced and professional players can use technical analysis to ally themselves with beginners, create engagement and attract followers.
- Changing market dynamics: Perhaps the most important aspect to understand is that the market works differently today than it did in the past, when many classic books on technical analysis were written. Back then, autocorrelation was higher, meaning that price movements tended to follow the same direction over time, and stocks showed clearer trends in both the short and medium term. This made technical analysis more reliable, as stock prices were better at trending and followed recognizable patterns. Today, market dynamics look different. Autocorrelation is significantly lower, meaning that price movements are more random and stocks trend less well, especially in the short term.
Choose objective methods over subjective ones
The right path is to avoid subjective judgments and use objective methods. It is important to distinguish between technical analysis and quantifiable signals from price data. Using quantifiable signals for trend-following strategies is something completely different from interpreting subjective patterns on graphs. By following the price without subjective interpretations, we can develop strategies that can actually be tested and validated over time – something that most subjective technical analysis methods lack.
There will always be “gurus” on social media who tout their success with methods that cannot be proven to work. Don’t be fooled! Ultimately, it’s about building a strategy based on objective data and a methodology that can be verified. This will allow us to act more consistently and provide a more stable foundation for long-term results than relying on subjective patterns and formations.
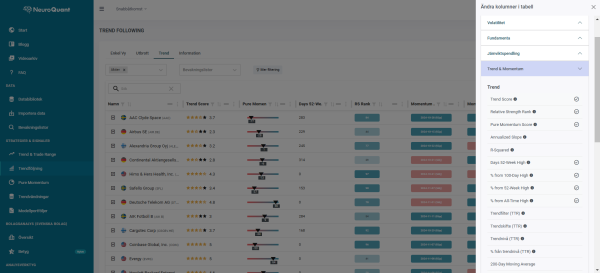
On our analysis platform, we have robust signals for trading different types of strategies with clear rules for entry, exit and position management.


