Momentum vs trend following – two paths to returns


When talking about systematic stock strategies, you often hear the terms momentum and trend following. They sound similar – both are about following the strength of price movements – but they are fundamentally two different approaches. The difference becomes clear when you look at how they work in practice and what results they produce over time.
In this post, we will clarify the differences between momentum and trend following, show a comparison between the two strategies, and conclude with what you should consider if you want to use these strategies.
What is momentum?
Momentum is about buying the stocks that have performed best recently, with the assumption that winners tend to continue to rise for a while longer. The strategy is based on relative strength. You compare stocks against each other and pick winners over a certain period, such as the last 6–12 months.
Characteristics of momentum:
- Higher turnover and more business.
- The return is based on a broad stream of smaller profits.
- Less dependence on individual extreme winners.
What is trend following?
Trend following is about identifying whether a stock is in an uptrend or not, and only owning it as long as the trend is intact. It is a more absolute method, often based on moving averages or price levels – for example, buying stocks that close at a new 52-day high. A trend following strategy has fewer trades and often holds a stock longer once a strong trend is underway. This is why trend following can result in fewer but larger profits.
Characteristics of trend following:
- Fewer trades and longer holding period.
- A few big winners often account for a large portion of the return.
- Can often protect the portfolio during longer downturns through exit rules.
Backtest: Momentum vs. trend following
To clearly show the difference, we can study the backtest of two of our strategies that trade momentum and trend following on stocks. The backtest refers to the period 2006 to 2025. The results below show that the strategies have similar CAGR (annualized return), but the path differs.
| Key figures | Trend Following OMX Weekly |
Pure Momentum OMX Weekly |
OMXSPI |
| CAGR | 17,3% | 17,1% | 5,5% |
| Sharpe | 0,98 | 0,91 | 0,27 |
| MaxDD | -39,5% | -42,2% | -58,7% |
| Volatility | 17,6% | 18,8% | 20,1% |
| Number of trades | 474 | 1206 | – |
| Average days/trade | 184 | 76 | – |
| Average profit | +64,5% | +30,9% | – |
| Average loss | -17,0% | -12,8% | – |
| Win Ratio | 44,3% | 45,3% | – |
| Max profit | +1987% | +837% | – |
| Max loss | -62,8% | -84,2% | – |
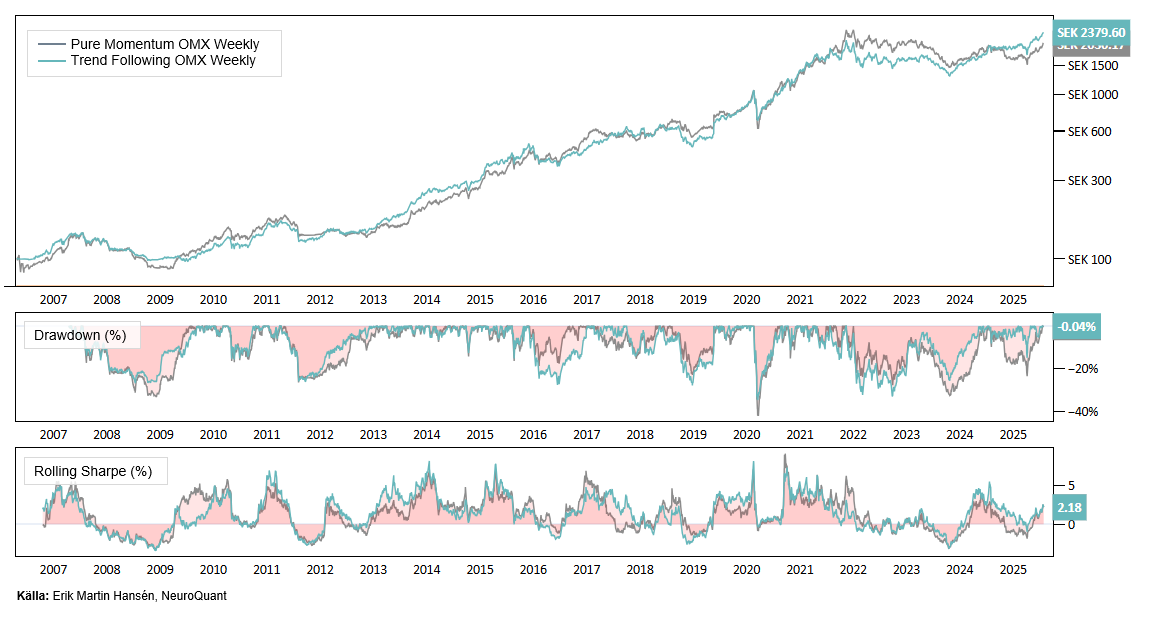
What do the statistics say?
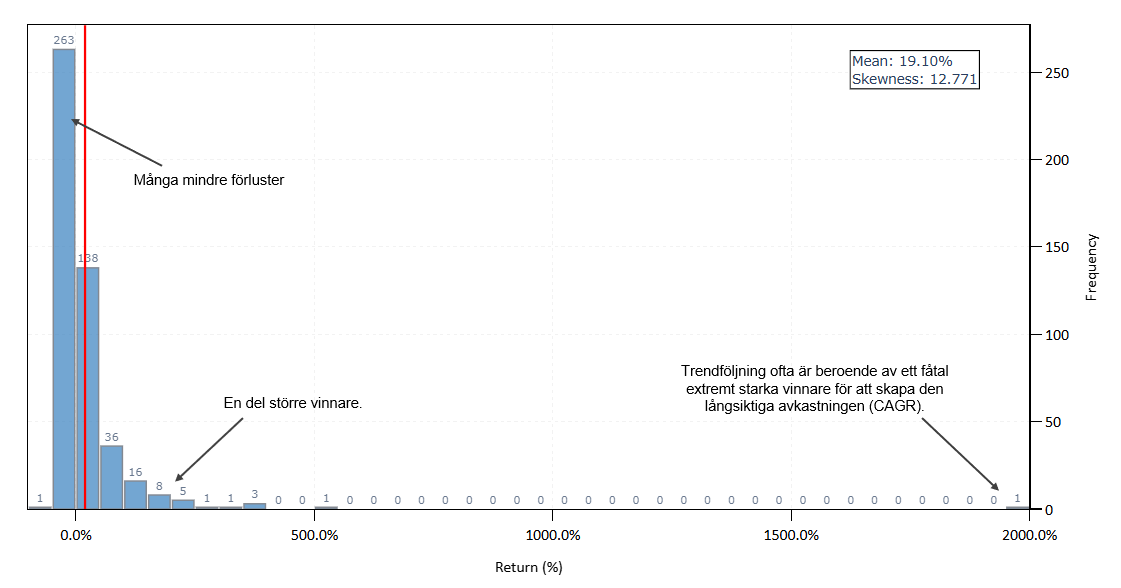
Trend following makes significantly fewer trades (474 compared to 1,206 for momentum) and holds stocks longer, an average of 184 days. This allows the strategy to capture large and prolonged moves. It is also why it has an extreme peak gain of almost +1987% – a sign that a few winners can carry a large portion of the results.
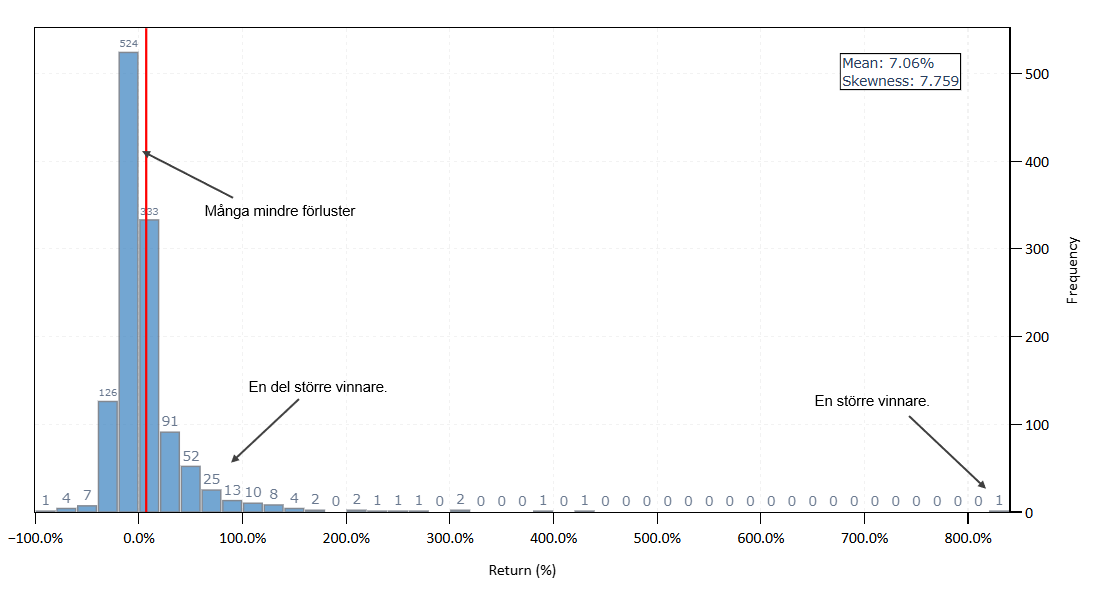
Momentum, on the other hand, rotates between stocks more quickly, with an average holding period of just 76 days. Rather than relying on single “monster trends,” momentum builds its returns on many shorter, more consistent gains.
Despite these differences, both strategies land on an almost identical annual return (CAGR around 17%), but the path to get there is completely different:
- Trend following: Fewer trades, bigger individual profits and more reliance on catching the really big trends.
- Momentum: More business and a smoother profit curve thanks to many smaller wins.
Distribution of profits and losses: Pure Momentum OMX Weekly
Distribution of profits and losses: Trend Following OMX Weekly
Holdings in the two different strategies
The momentum strategy rotates between the stocks that have had the best volatility-adjusted performance, while the trend-following strategy holds longer positions and focuses on stocks with strong upward trends.
Below you can see a summary of current holdings. Backtest used a maximum of 20 holdings in the portfolios and we can see that 10 of the holdings are currently common.
It is clear that the momentum strategy rotates more aggressively and captures companies with recent uptrends, while the trend following has more “stronger” trends and can hold stocks longer. The overlap shows that some companies have both short-term momentum and long-term trend strength, making them particularly strong candidates.
Current holdings: Pure Momentum OMX Weekly
| Name | Entry | Weight |
| Ascelia Pharma | 2025-07-28 | 4,8% |
| Sectra B | 2025-07-21 | 5,2% |
| Intrum | 2025-07-21 | 4,2% |
| Active Biotech | 2025-07-07 | 5,1% |
| ProfileGroups B | 2025-06-23 | 4,2% |
| Infra | 2025-06-23 | 4,4% |
| Acrinova B | 2025-06-16 | 4,7% |
| Eltel | 2025-06-09 | 4,6% |
| Tele2 B | 2025-06-02 | 5,0% |
| AcadeMedia | 2025-06-02 | 5,0% |
| Rejlers B | 2025-05-26 | 4,7% |
| Bonava B | 2025-05-19 | 4,1% |
| Bernese Industries B | 2025-05-12 | 6,2% |
| Lammhults Design Group B | 2025-04-22 | 5,0% |
| mySafety Group B | 2025-04-07 | 4,8% |
| TradeDoubler | 2025-04-07 | 6,4% |
| GET B | 2025-04-07 | 4,6% |
| Actic Group | 2025-04-07 | 8,4% |
| Clas Ohlson B | 2025-01-13 | 4,6% |
| Lundin Gold | 2024-10-28 | 4,2% |
Current holdings: Trend Following OMX Weekly
| Name | Entry | Weight |
| Studsvik | 2025-07-21 | 4,8% |
| Intrum | 2025-07-21 | 5,2% |
| Sanion | 2025-06-23 | 4,2% |
| ProfileGroups B | 2025-06-23 | 5,1% |
| Avanza Bank | 2025-05-26 | 4,2% |
| AddLife B | 2025-05-12 | 4,4% |
| Lammhults Design Group B | 2025-04-22 | 4,7% |
| Clas Ohlson B | 2025-04-22 | 4,6% |
| Bernese Industries B | 2025-04-22 | 5,0% |
| TradeDoubler | 2025-03-17 | 5,0% |
| GET B | 2025-03-17 | 4,7% |
| Actic Group | 2025-03-10 | 4,1% |
| mySafety Group B | 2025-03-03 | 6,2% |
| SynAct Pharma | 2025-02-10 | 5,0% |
| RaySearch Laboratories B | 2024-11-25 | 4,8% |
| CoinShares International Limited | 2024-11-25 | 6,4% |
| EQL Pharma | 2024-10-28 | 4,6% |
| Cloetta | 2024-10-14 | 8,4% |
| Lundin Gold | 2024-09-16 | 4,6% |
| Nelly Group | 2023-11-13 | 4,2% |
Good to think about
- Discipline and rules are key. Both momentum and trend following only work if you consistently follow your signals.
- The combination can be powerful. For example, choosing stocks with strong momentum but only buying them when the entire market is in a positive trend.
- Diversification is always needed. Both strategies can have periods of weakness.
- Patience is the key. Trend following requires patience to ride the winners, while momentum requires you to endure the rotation.
Remember that trend following often depends on a few extremely strong winners to create the long-term return (CAGR). The strategy lets the winners run for a long time and it is these individual “monster trends” that can carry a large part of the portfolio’s overall performance. If you miss one or two of these, the return can drop sharply.
Momentum, on the other hand, has higher turnover and continuously rotates between the strongest stocks. Therefore, the strategy becomes less dependent on individual extreme winners and instead builds returns on a more steady stream of shorter upswings.
Conclusion
Statistics clearly show that both momentum and trend following can deliver high returns, but in completely different ways. Trend following shines when large and prolonged trends emerge, and the strategy is more dependent on catching these winners – if you miss them, returns can plummet. Momentum, on the other hand, thrives on constant rotation and builds returns on many smaller but stable wins, making the strategy less sensitive to individual extreme cases.
Although both strategies have similar long-term returns (CAGR), the path to getting there is different. Trend following with 52-week breakouts is more long-term and rides on a few big winners, while the momentum strategy with 120-day lookback builds its returns on more and shorter trades. It is therefore not a question of which is “best” in absolute terms, but rather an illustration of how two different methods can exploit market strength in different ways.
It is therefore not a question of right or wrong strategy. It's more about taste and what type of trip you prefer.Some like to let the winners run and have fewer trades (trend following), while others prefer a faster rotation and smoother wins (momentum).
Curious about trading according to our strategies?
Not a customer? Open an account to access our analytics service.
ℹ️ IMPORTANT INFORMATION
Our momentum strategies are based on objective and transparent rules – without gut feelings or subjective interpretations. The focus is on stable momentum combined with consistent risk management. The aim is to create clear decision-making and a disciplined investment process – free from emotional mistakes.
We help investors make better decisions by offering structured methods with proven historical strength, rather than trying to predict the market’s next move. Momentum is one of the most robust anomalies in financial markets – unlike many other factors that appear and quickly disappear. But even the best strategy can fail if it is not followed.
Common mistakes include exiting positions too early, chasing overheated trends, ignoring exit signals, or taking too large positions. Many people allow themselves to be swayed by short-term volatility, lack of patience, and emotional decisions – which often undermines the long-term profitability of the strategy.
Discipline and risk management are crucial to success.
⚠️ RISK WARNING
Investing in financial markets always involves risk. Past performance is no guarantee of future results, and there is a possibility that you may lose all or part of your invested capital. Our analyses and indicators are based on historical data and statistical models, but these models cannot predict future market movements with complete certainty.
The value of investments may fluctuate significantly due to market conditions, company-specific factors and global economic events. It is important that you carefully consider your financial situation and your ability to bear potential losses before investing. The Service does not provide personal investment advice and recommends that you seek independent financial advice before making any investment decisions.
NeuroQuant employees may own or trade securities mentioned in analyses or based on indicators used in our services. This may potentially create conflicts of interest, but we strive for full transparency and professional integrity in all our activities. Following our analyses and indicators involves increased risk if the market moves in an unpredictable manner. You should only invest money that you are prepared to lose and understand that past performance, analyses or models provided through the service do not guarantee future results.