When the graph lies – and why you should back away like a flame


Sometimes graphs appear on social media that get hundreds of likes and are widely shared. They look seductively convincing – with seemingly perfect relationships between two variables, often with precise time lags or superimposed patterns that fit almost too well. But when something looks so perfect in retrospect, it’s often a sign that the presentation is designed to persuade rather than explain.
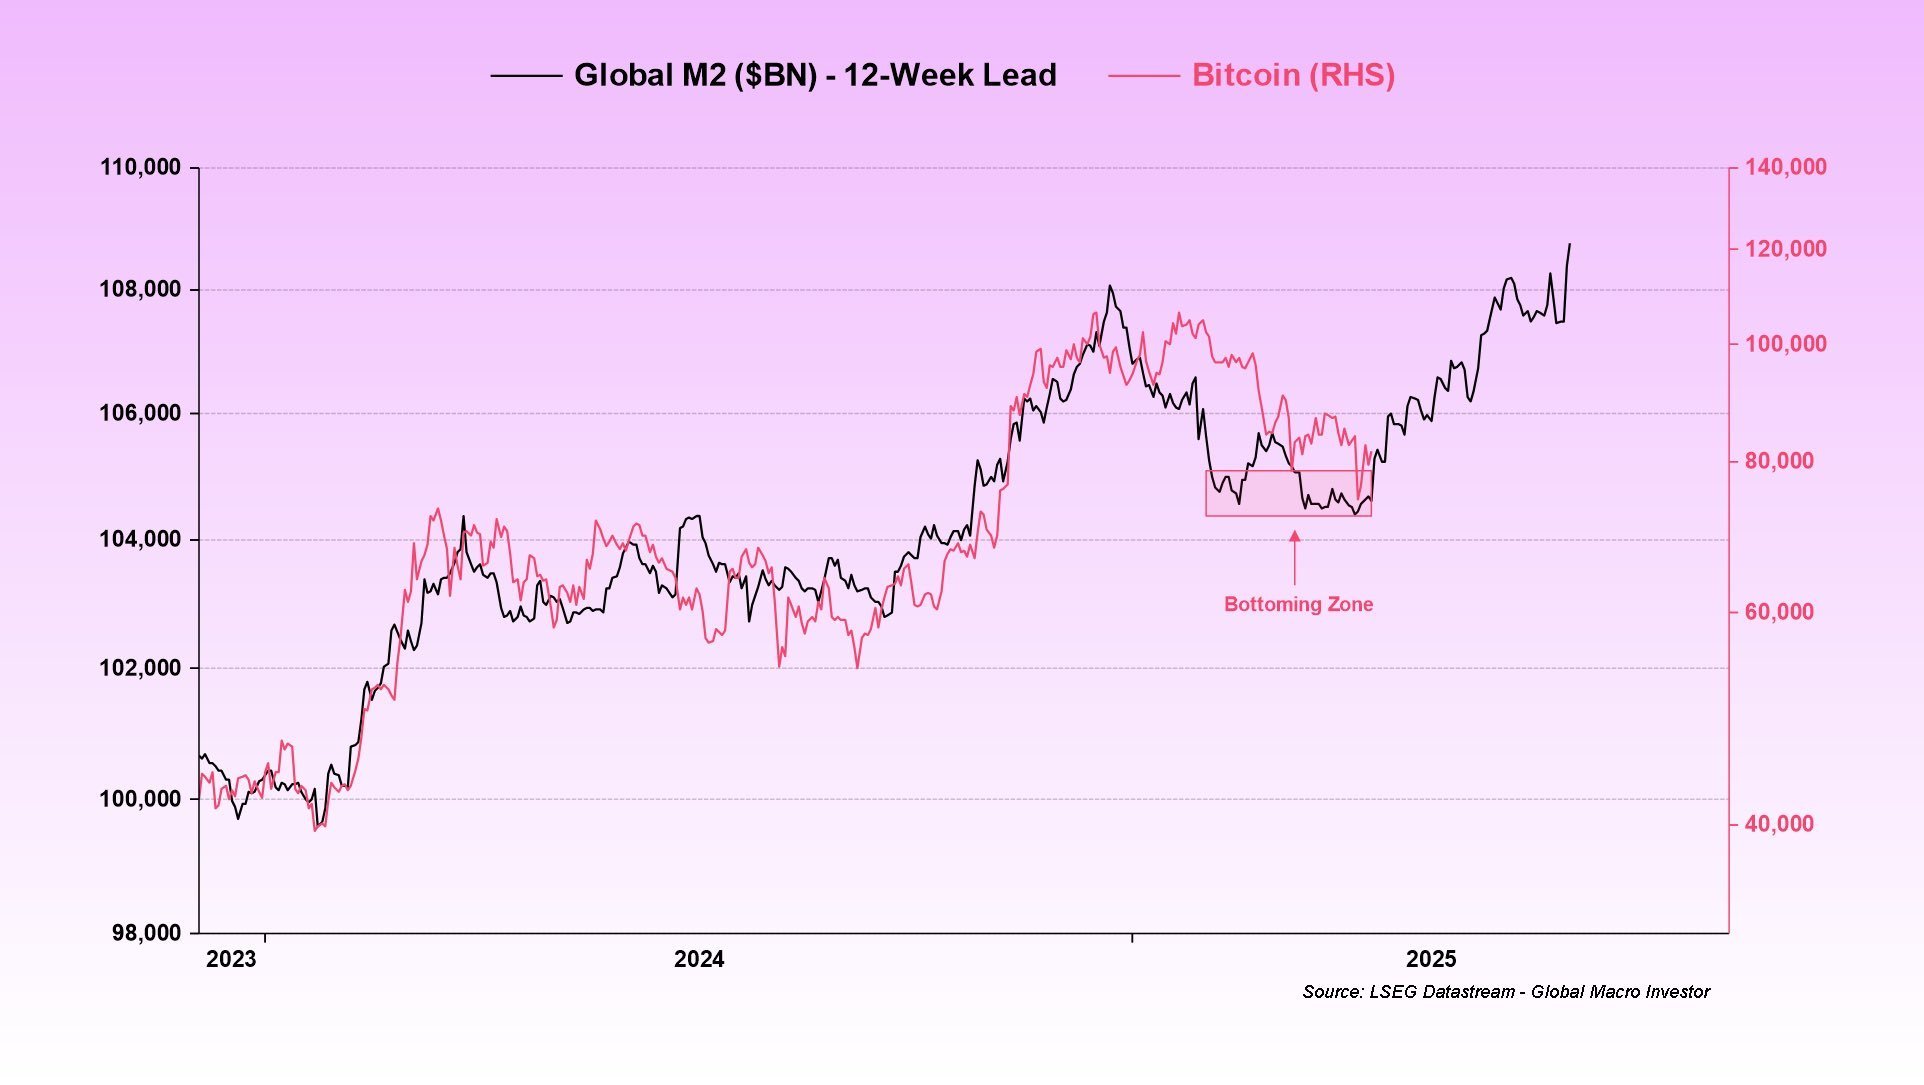
An example currently circulating is a graph where bitcoin appears to follow the global money supply (Global M2) with exactly 12 weeks of lag.
The connection looks perfect… almost too perfect.
And that's exactly where you should back away – like from an open fire.
What is the problem?
First: Global M2 is not a high-frequency time series. The US updates its M2 weekly, but the rest of the world – including the EU, Japan and China – publishes monthly data, often with a lag. Creating a daily or weekly graph is therefore a form of visual illusion, with most of the “movement” actually reflecting exchange rate movements rather than actual changes in the money supply.
Second, “moving forward” a lagging indicator by 12 weeks to match the price movement of bitcoin is a classic example of backward engineering. It may look convincing on a chart, but has no analytical value unless the hypothesis is first objectively tested – which is rarely the case.
Visualizing this as a weekly series and simultaneously shifting it in time is not analysis. It's backward-engineered storytelling.
When commitment wins over honesty
Graphs with a lot of likes are often designed to be visually convincing – not to stand as a pedestal for serious analysis. They confirm a feeling, not a model. But feelings are a weak basis for decisions in a market where risk and chance reign.
Behind these types of conclusions is often a combination of ignorance, naivety or a stated purpose to create engagement and attract more followers. When a graph gets spread, it is rarely about its methodological robustness – without it telling a story that feels good to believe. And that is precisely why one should be extra skeptical.
My advice
Be skeptical of fancy graphs with precise time offsets that make it look like the market is following an invisible script. There is no magic indicator that predicts the price 84 days in advance.
And above all – don't let Twitter graphs with 100s of likes influence your investment decisions.