Our top 10 lists – built on powerful factor scores


To help you find inspiration in the stock market, we have created ten unique top lists. They are based on our factor ratings – a combination of fundamental strength, valuation, risk and trend quality. Unlike many other players, our lists are not based on opinions or gut feelings, but on systematic rules and research.
Our approach is clear: we prefer to go with the trend rather than try to go against it. The research is clear – winners tend to keep winning.
We have excluded stocks with price gaps of over 30%, such as those in takeover bids. This means we focus on stocks that are driven by real trends, not isolated news events.
Our top lists
Quality rockets
The selection includes Swedish companies with the highest possible quality rating and relatively low risk, sorted by strongest medium-term momentum. The emphasis is on stable, high-quality stocks with a clear positive trend.
Quality value
The selection consists of Swedish companies with both the highest quality and attractive valuation, where companies with high price risk have been excluded. Sorted by Trend Rating to find the strongest long-term trends.
Silent stars
The selection includes fundamentally strong Swedish companies that are already showing positive 12-1 momentum, sorted by highest FIP. These are stocks with steady and calm gains – often overlooked by the market.
Value winner
Well-valued Swedish companies with strong, sustainable trends and relatively low risk, sorted by Trend Rating. For investors who want to combine attractive valuation with technical strength.
Stealth strength
Swedish stocks with positive 12–1 momentum and that do not exhibit high risk, sorted by FIP Momentum. The list focuses on trends that have built up gradually, which increases the chance that the uptrend can continue without sharp fluctuations.
Overachiever
The selection consists of Swedish companies with a market capitalization of over SEK 5 billion and where companies with higher price risk have been excluded, sorted by RS Rank. The focus is on stocks that have outperformed the market and continue to show relative strength.
Profit engines
The selection consists of Swedish companies with the highest earnings ratings, where companies with high price risk have been excluded, sorted by FIP Momentum. For investors looking for a combination of strong earnings growth and sustainable trends.
Defensive gems
The selection consists of Swedish low-risk stocks with good quality, sorted by FIP Momentum. Here you will find the stable companies that can provide steady returns even in more turbulent market situations.
Safe trends
The selection consists of Swedish low-risk stocks with attractive valuations, sorted by FIP Momentum. The portfolio focuses on safe cases where both price and valuation point to continued upside.
Small company list
The selection consists of smaller Swedish companies where companies with poor profit development and low quality have been excluded, and where companies with high price risk have been filtered out. Only stocks with positive 12–1 momentum are included. Sorted by FIP to find small companies with sustainable trend strength and good fundamental development.
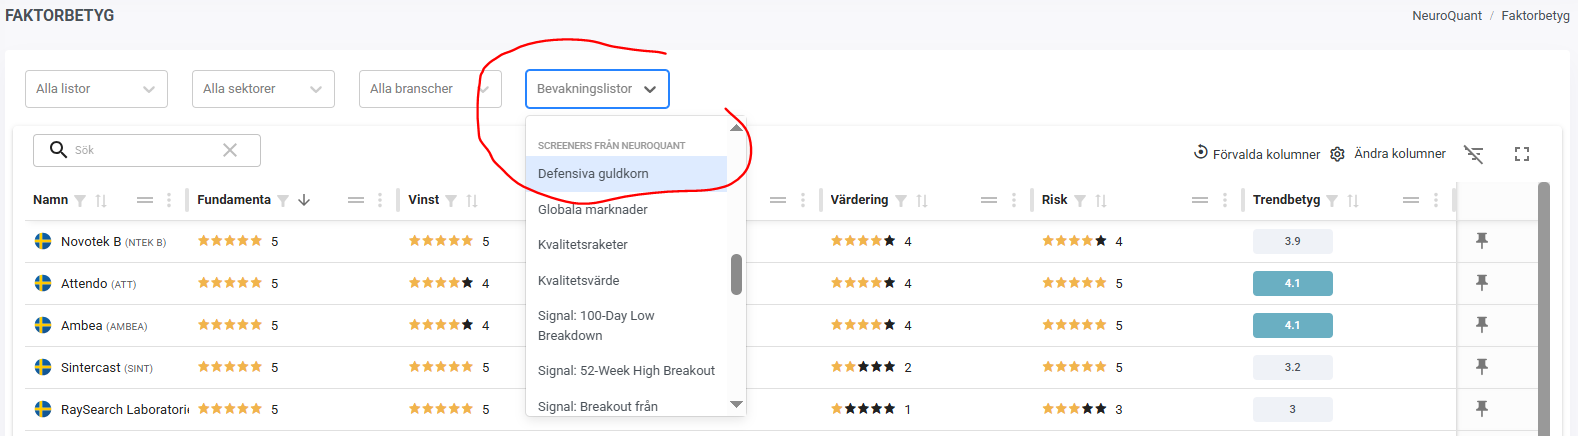
Where can I find the leaderboards?
You can find our top lists among our watchlists. They are located on the Watchlists page and also appear via the Watchlists filter field above tables on several different pages on the platform.
ℹ️ INFORMATION
Fundamental rating
A score (1-5) on the company's fundamentals based on earnings, quality, valuation and risk – with earnings and quality being the most important. A higher score indicates stronger fundamentals. In the long term, share prices tend to follow fundamental factors, while short-term developments are often driven by sentiment and external events. By combining fundamentals with trend-following in the share price, we gain strength from both perspectives.
Quality rating
A score (1–5) on the company's fundamental quality, where the assessment is based on profitability, debt, earnings quality and dividends. Companies that demonstrate high margins and strong return on capital, combined with low debt, good earnings quality and a growing dividend, are given a higher score. It is worth noting that companies without dividends are not penalized, as the focus is primarily on long-term fundamental factors that indicate financial stability and quality.
Profit rating
Rating (1–5) of the company's profit development, changes in estimates and conditions for maintaining profit growth. In addition to the change in profit development, sustainable and non-sustainable components are also examined - for example, sustainable elements such as cash flow from core operations and operational efficiency, and non-sustainable elements such as one-off income and temporary cost savings. The higher the rating, the better the company's stability and long-term potential is considered to be.
Rating
Rating (1–5) of the valuation based on several valuation multiples, including Trailing P/E, Forward P/E and Price/Sales. The valuation is compared both against the historical average for the stock and relative to the sector, with adjustments for the banking and real estate sectors. The higher the rating, the more attractive the valuation is considered.
Risk rating
A rating (1–5) of the company's risk profile based on historical performance. The assessment is based on four factors: extreme price movements (the largest ups and downs), volatility, beta and correlation – both in the short and long term. Each factor is given equal weight. Larger and more stable companies with predictable movement patterns generally receive higher ratings. The higher the number, the lower the risk the stock is considered to have.
Pure Momentum
Ranking (-100 to 100) based on a ranking of companies with strong momentum (slope of exponential regression) in the medium term (approximately 6 months) adjusted for volatility (R-squared). The rating is used for our systematic momentum strategy, Pure Momentum, but can also be used to quickly sort stocks by medium-term momentum for other purposes.
FIP Momentum
FIP (Frog-in-the-Pan) is a measure of momentum quality that compares the percentage of positive days over the past year. A high FIP indicates a calm and steady uptrend – a type of trend that investors often underestimate. Research shows that the market tends to underreact to these gradual movements, which often causes the trend to continue longer than expected.
RS Rank
RS Rank (1-100) shows the relative performance compared to other stocks. The relative performance is based on the price performance for the last 3, 6, 9 and 12 months, with greater emphasis on the last quarter. A high level of 90 means that the stock outperforms 90% of other stocks. The starting point is that winners remain winners and losers remain losers in the medium term. Don't forget that diversification, position and risk management are more important than buy signals in momentum strategies. Also keep in mind that RS Rank does not take into account the path of development.
12-1 momentum
Momentum is calculated as the performance of the last 12 months, but excluding the last month. Research shows that the last month often contains noise and short-term countermoves. Skipping it often improves the momentum signal.
Trend rating
Price trend rating (1-5) based on both price and momentum over the short, medium and long term, with the greatest emphasis on the long-term primary trend driven by fundamentals. Our premise is that signals work best in line with the trend, but in the short term – from days to weeks – there is a lot of noise and random fluctuations.