Report reactions and profit clock

During reporting periods, I always whine about price reactions.
How the market receives a report provides an indication of future price development.
A stock that rises on a bad report is a signal that the stock is demand-driven.
Investors tend to underreact to positive information and a drift in the stock is created.
Post–earnings-announcement drift
Those of you who studied finance at university have probably come across the concept of post-earnings-announcement drift.
Anomalin förklarades av J. Ball & P. Brown, ‘An empirical evaluation of accounting income numbers’, Journal of Accounting Research, 1968.
Information from ChatGPT:
Post Earnings Announcement Drift (PEAD) is a phenomenon in financial markets where stock prices tend to continue moving in the same direction as an initial reaction to a company's earnings report.
This means that if a company reports better-than-expected results and the stock price rises immediately after the announcement, the stock price tends to continue to rise in the following weeks or months. Similarly, if the company reports worse-than-expected results and the stock price falls, the stock price tends to continue to fall for some time.
Here are some key points about PEAD:
- Initial reaction: After a company's earnings announcement, the market reacts immediately to the information. If the report exceeds expectations, the stock price can rise quickly; if it underperforms, the price can fall quickly.
- Continued operation: After the initial reaction, the stock tends to continue moving in the same direction for a period of time, often several weeks to months. This is PEAD.
- Causes: There are several theories as to why PEAD occurs. One is that the market is slow to fully integrate new information into the stock price. Another theory is that investors are overly conservative in their reaction to new information, leading to a gradual adjustment in the stock price.
- Strategies: Investors and traders can try to exploit PEAD by buying stocks that have reported better-than-expected results and selling or shorting stocks that have reported worse-than-expected results.
- Efficient market hypothesis: PEAD challenges the strong form of the efficient market hypothesis (EMH), which states that all available information is always reflected in stock prices immediately.
Does the anomaly still exist?
Of course, otherwise I wouldn't have written about it.
Here is one blog post with a few years under his belt where the blogger was inspired by my market analysis.
Let's run the statistics for the companies on the Stockholm Stock Exchange to include recent years. We look at the 40 most recent quarters.
Statistics PEAD for the Stockholm Stock Exchange
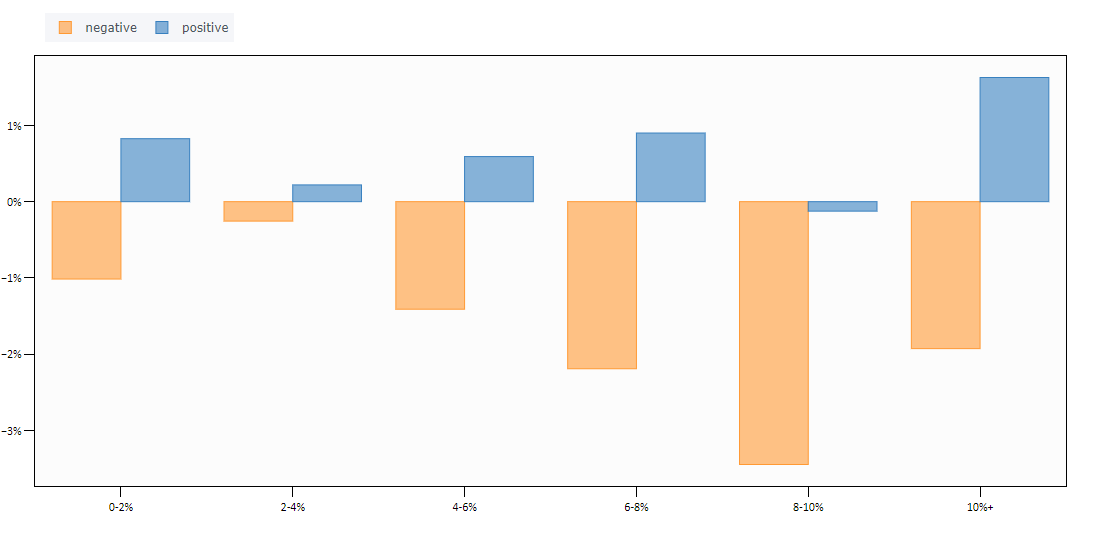
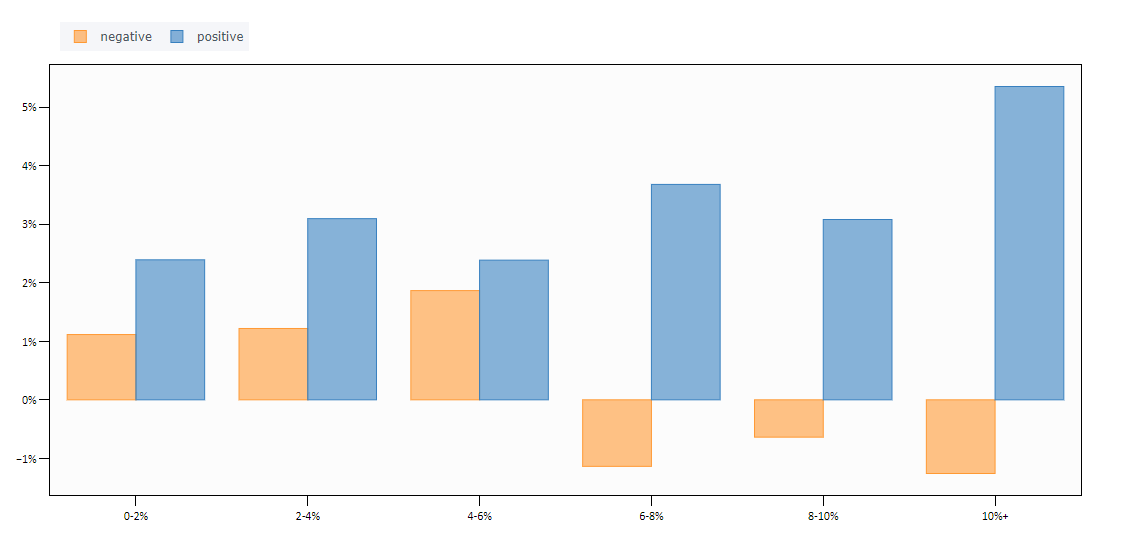
What we can take away from the graphs below is that we should not be afraid to buy stocks that have risen on their report.
Many people think:
“The stock has already risen and I missed buying. Buying this stock instead that looks cheaper.”
Don't think like most others!
We shouldn't be afraid to buy stocks that are rising. The stock market is not the store where we like to shop on sale.
Average return 50 days for negative and positive report reactions
Average return 20 days for negative and positive report reactions 
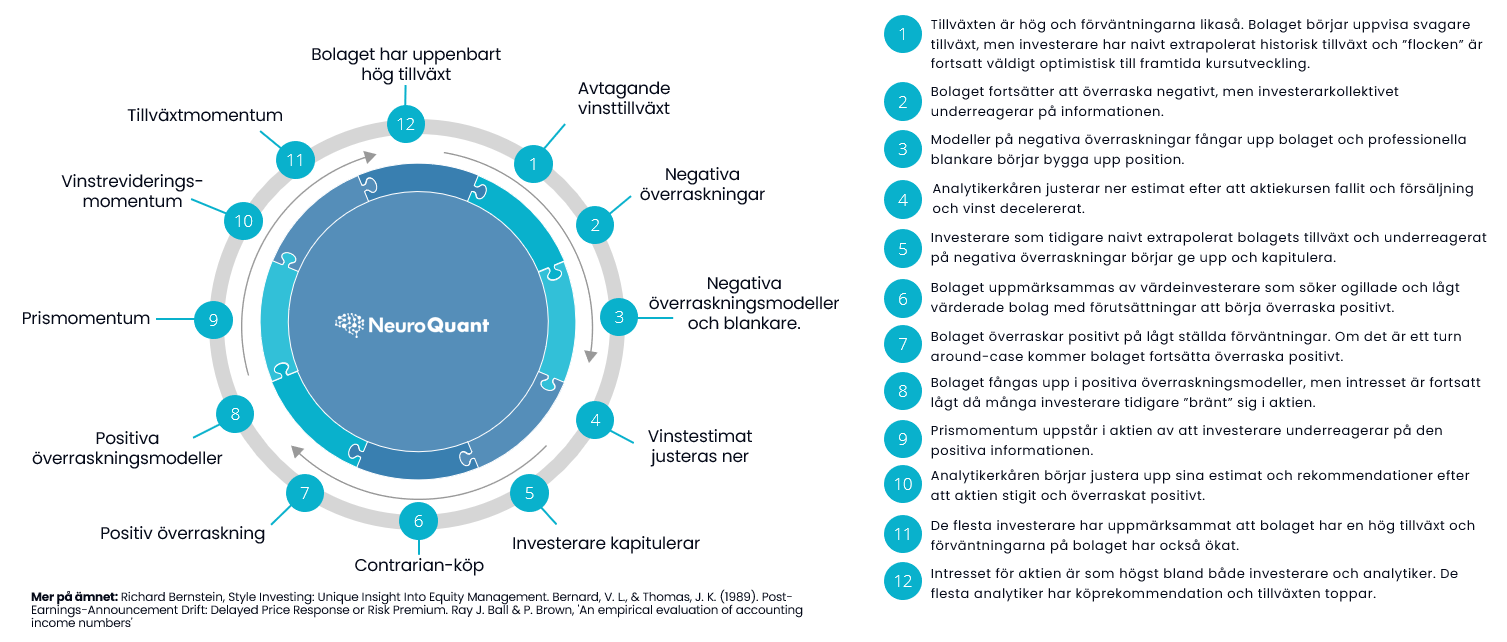
The winning clock
The profit clock illustrates the concept and shows in broad outline what it usually looks like after we capture positive surprises.
These surprises create price momentum and then positive earnings revisions and growth momentum.
If you trade momentum, you are approximately between 8 o'clock and 1 (13).
Report reactions
Among the holdings in the model portfolios, 15 out of 63 companies have reported.
The biggest negative price reactions* have been Addnode (-16%) and Protector (-11%).
This is offset by many positive surprises from, among others, Hexatronic (18%), Peab (+8%), ITAB (+6%), Proact IT (+5), Inwido (+13).
To view report reactions, you must log in to the analysis platform.
Not a customer? Open an account to access our analytics service.


