How we use breadth indicators
In the data library we have a wealth of price data and different types of indicators. Our breadth indicators show how the underlying stocks in an index are performing. These indicators can also be applied to commodities, currencies (FX) or interest rates.
A breadth indicator provides an extra dimension compared to just studying the price development of an index. When a stock index reaches a major peak, it is often a process where fewer and fewer stocks reach new highs. This can be captured with the help of a breadth indicator.
We can also use breadth indicators to quantify capitulation which can often set a bottom.
Examples of different width indicators
Breadth indicators can show, among other things, what % of stocks are trading above different types of moving averages or show the ratio between the number of stocks rising and falling. There are, in my opinion, two main categories of breadth indicators:
Long-term breadth indicators: Long-term breadth indicators are used to define market phases and prepare for major tops and bottoms. They are not intended for short-term timing, but rather to identify overall market directions and key turning points.
Short-term breadth indicators: Another type of breadth indicator captures behavioral patterns, such as capitulation, that we often see at low points in both the short-term and intermediate trend. Examples of such indicators are TRIN and Advance/Decline Line Ratio.
A selection of width indicators on the platform:
- 52-Week High/Low Net
- Advance/Decline Line
- Advance/Decline Volume Line
- Advance/Decline Ratio
- Breadth Thurst
- % above MA(200)
- % above MA(100)
- % above MA(20)
- % of equities with RSI(14) Above 50
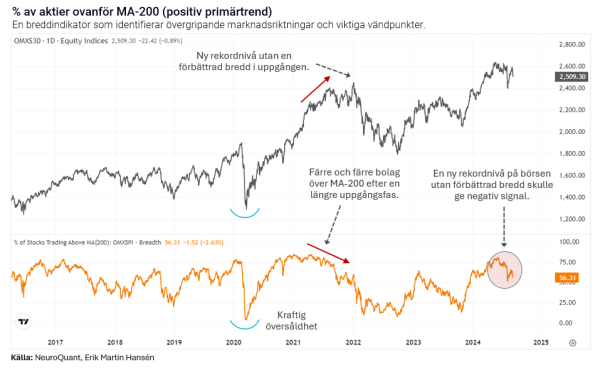
Percentage of companies above MA(200)
The interpretation of the proportion of companies above MA(200) is brief, the more companies above MA-200 the better. But the relationship is not linear and there are nuances. Even if there is a high proportion of shares traded above MA(200), it can be interpreted as a negative signal if the indicator has turned down from even higher levels after a long bull market. Another signal is given if there are few companies trading in a positive primary trend. Interpreted positively for the next 6-12 months.
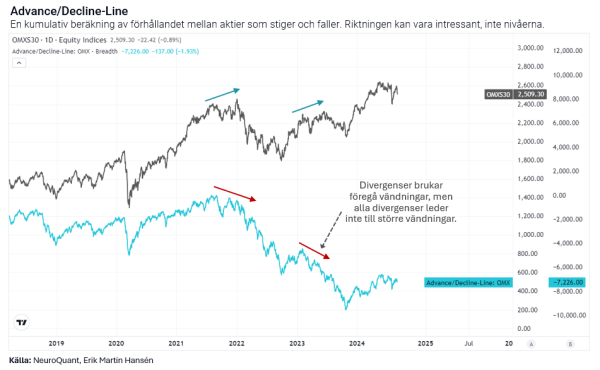
 Advance/Decline-Line
The Advance/Decline-Line consists of a line that cumulatively calculates companies that rise and fall. An ascending line is positive and a descending line is negative. The idea is that the indicator should confirm the direction of the index. If it does not confirm the direction, it is a divergence that signals a reversal. Keep in mind, however, that although divergences often precede reversals, not all divergences lead to reversals. It has a greater signal value at the end of a longer uptrend than at the beginning of an uptrend.
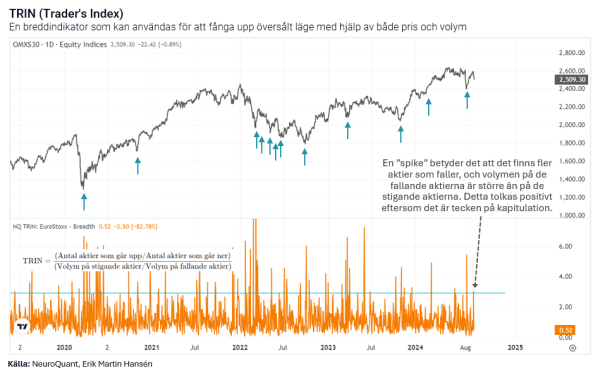
 TRIN (Trader’s Index)
TRIN calculates using both price and volume. Signals are given when there is a large increase in the indicator. A “spike” means that there are more stocks falling, and the volume of the falling stocks is greater than that of the rising stocks. This is interpreted positively because it is a sign of capitulation.
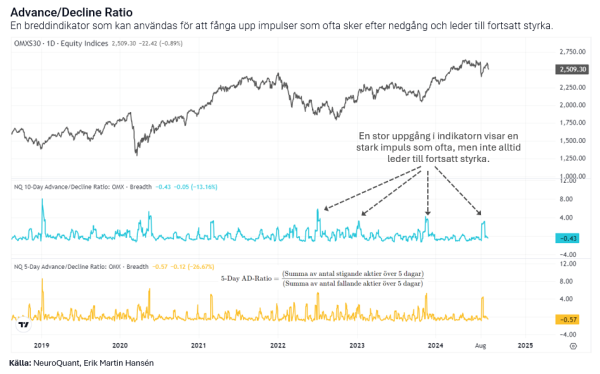
 5-Day Advance/Decline Ratio
This is a broad indicator that captures behavior that occurs over a short period of time, in this case 5 days. At a bottom we often see increased volatility and sharp declines followed by sharp rises. The idea is to capture a change in sentiment with this indicator. No indicator is 100% accurate, but it can, together with a basket of indicators, act as a decision support.
 Good to think about
There is no indicator based on price that says the price has to do something. Indicators are derivatives of price that are driven by supply and demand. Someone who has a strong belief that a price will turn because of an indicator lacks knowledge about how the market works, is naive, or wants to ally and create engagement with beginners who like the idea that it should work.
We should use a basket of indicators because a basket of indicators is less likely to give false signals than individual indicators.
Click here to open a free demo account.


