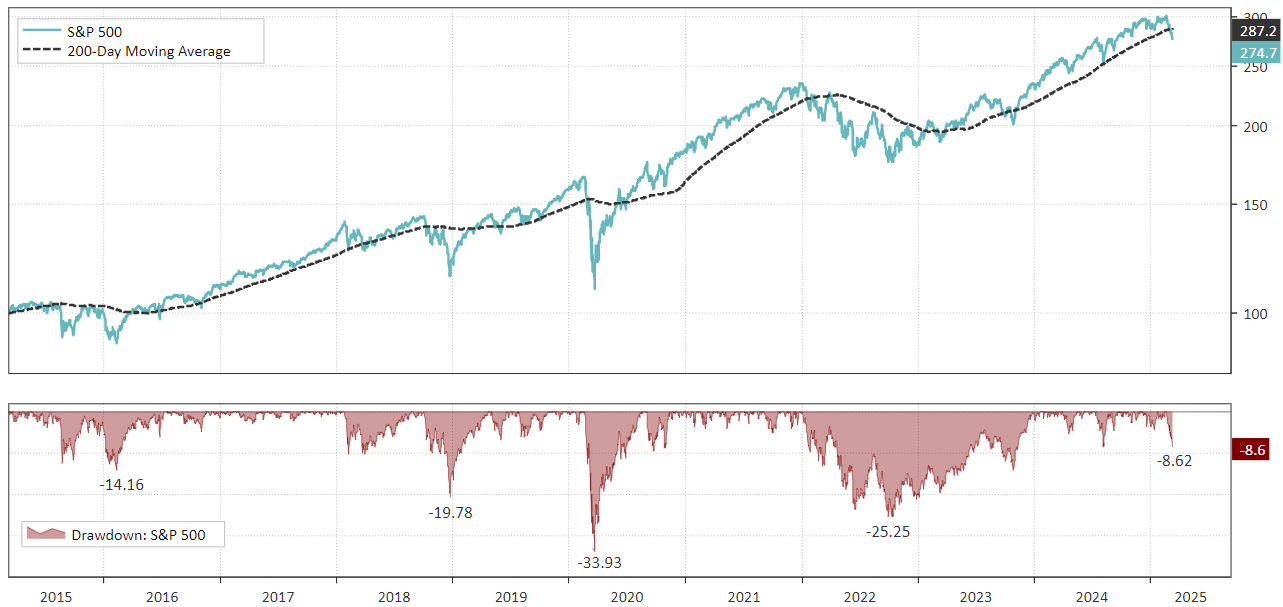
S&P 500 breaks MA-200 – Is it time to sell?

The S&P 500 has just broken below its 200-day moving average (MA-200), a classic sell signal that raises eyebrows among many investors. Historically, this has been seen as a warning sign of weaker stock market performance. But how reliable is this signal? And is there a better way to navigate the market than to stare blindly at the MA-200?
The 200-day moving average is one of the most well-known technical indicators. During the mid-20th century, technical analysts began to notice that the 200-day moving average served as an important support level during bull markets and a resistance level during bear markets. It was especially popular with traders on Wall Street from the 1960s onward.
Why 200 days? 200 days corresponds to approximately one trading year, excluding weekends and certain public holidays.
“My yardstick for everything I look at is the 200-day moving average of closing prices. I've seen too many things go to zero, stocks and commodities. The whole trick in investing is, 'How do I avoid losing everything?' If you use the 200-day moving average rule, then you get out. You play defense, and you get out.” – Paul Tudor Jones
Paul Tudor Jones is a trader, not a long-term investor. If Warren Buffett had sold every time stocks fell below their 200-day moving average, he would never have owned Coca-Cola or Apple for so long.
The simple truth is that the MA-200 has a flaw – it gives a lot of false signals. It reacts quickly to short-term fluctuations and can trigger both buy and sell signals that soon turn out to be incorrect.
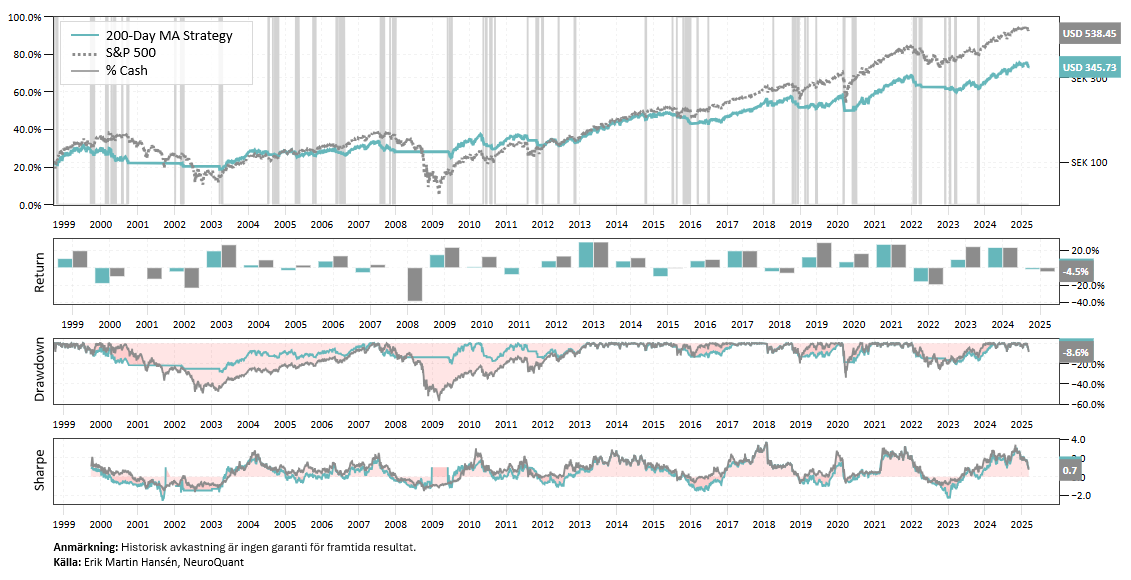
This is how well the MA-200 has performed on the S&P 500
We are testing a strategy that buys the S&P 500 the day after the index closes above its 200-day moving average and sells when it closes below.
Since 2000, the strategy has executed 98 trades, of which only 24% have been profitable. The strategy has had a lower maximum drawdown, but worse returns than the S&P 500 and a Sharpe of only 0.42.
Blindly relying on the 200-day moving average is like having a smoke alarm that beeps every time you toast bread – sure, it sometimes warns of real danger, but most of the time you run around in a panic unnecessarily.
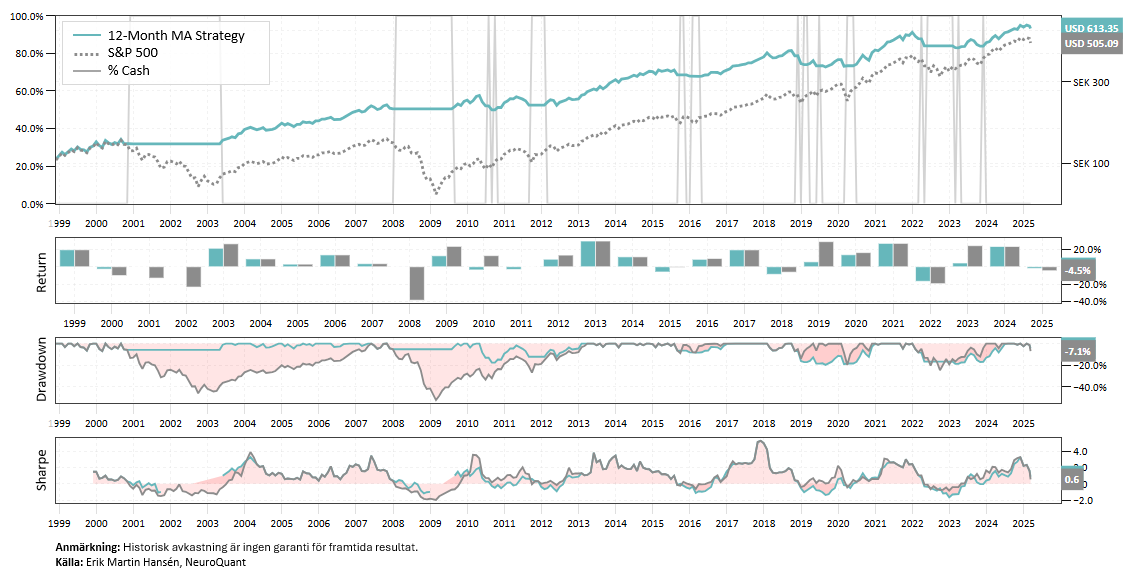
12-month moving average provides fewer false signals
Let's test the 12-month moving average instead. The strategy buys on the first trading day of the month after the index closes above its 12-month moving average. Sells on the first trading day of the month after the index closes below its 12-month moving average.
This strategy has outperformed the 200-day moving average strategy by only 18 trades. The percentage of winning trades has been 60%, and the largest decline in the portfolio has been about 20%, which is significantly lower than the maximum decline of the S&P 500.
Compared to the MA-200, the MA-12 checks once a month, filtering out much of the market noise. This means fewer trades and a greater chance of catching the real trends instead of getting caught up in short-term fluctuations. Historical data shows that a strategy based on the MA-12 has not only outperformed the MA-200 but has also outperformed the S&P 500 by keeping investors out of major downturns and even during long uptrends.
But it doesn't stop there. The MA-12 has not only beaten the index – it has also repeatedly outperformed all macro forecasts, experts and pundits who try to time the market's peaks and troughs. Year after year we hear analyses about business cycles and recessions that "must" be around the corner. Experts who try to predict the development of the economy with a few observations and confirmation bias end up wrong more often than right, and those who constantly whine about the big crash have missed years of upswings.
In reality, a simple trend-following strategy like the MA-12 has proven to be more effective than sophisticated macro analysis. It is a reminder that the market is unpredictable and that it is better to react to actual price movements than to try to predict the future with guesswork.
| 200-day MA | 12-month MA | Buy-and-hold | |
| Number of shops | 98 | 18 | 1 |
| CAGR | 4.9% | 7.1% | 6.6% |
| Sharpe | 0.42 | 0.70 | 0.34 |
| MaxDD | -28.3% | -19.8% | -56.8% |
| Volatility | 11.5% | 10.1% | 19.3% |
| Win Ratio | 24.5% | 60% | n/a |
The challenge of simple trend following
Even if a strategy with an MA-12 has beaten the index, it doesn't mean it's easy to follow. The market is a constantly roaring machine filled with news, rumors, and daily fluctuations that test our patience. Our cognitive distortions make it difficult to stick to a strategy when everything around us signals that we should act differently.
The big challenge with any trend-following strategy isn’t the signals themselves – it’s us. Following a method that sometimes tells us to sit still when the market swings wildly requires discipline and patience. When the MA-12 tells us to stay invested, but the market shakes, it’s hard not to start having doubts. The same goes for when a sell signal comes, but the index quickly turns back up.
Even systematic strategies have their shortcomings
Although trend following has historically worked well, it is not a strategy without risks. Systematic models are based on the assumption that market behavior follows certain patterns, but these patterns can change during major regime shifts. For example, a long period of sideways trading can cause trend following strategies to generate many false signals and underperform.
Additionally, it is important to understand that no strategy works perfectly in all market environments. What has worked well for decades may stop working if the underlying market conditions change.
Closing words
Anyone who can ignore the noise and stick to a robust strategy has a huge advantage in the market.
So the question is:
Do you dare to trust strategy when it really matters, or do you let emotions guide your decisions?


