The metrics that reveal the next stock market winner

One of the most common strategies for finding winners in the stock market is to follow the trend. It may sound banal – but there is plenty of research that shows that stocks that have performed strongly recently often continue to rise. It is called the momentum effect and has been documented in markets all over the world.
Trend following sounds simple – but is anything but easy
Just because stocks are trending doesn't mean it's easy to make money from these movements. Quite the opposite. Many investors sell too early – either because they don't want to give back some of their profits, or because they want to quickly minimize small losses. Others get off a winner too early because they feel good about taking a profit.
Decisions are often made on gut feelings, fear, or random signals rather than through a clear, systematic strategy. Trend following and momentum sound simple in theory: buy what goes up, sell what goes down. But in practice it’s hard – psychologically hard. It requires patience, discipline, and the ability to resist our natural impulses. That’s why it works. Because so few people manage to be consistent.
To succeed at trend following, it's not enough to understand the concept – you have to have a systematic approach, follow it consistently, and be prepared to challenge your own emotions along the way. That's where the real returns lie.
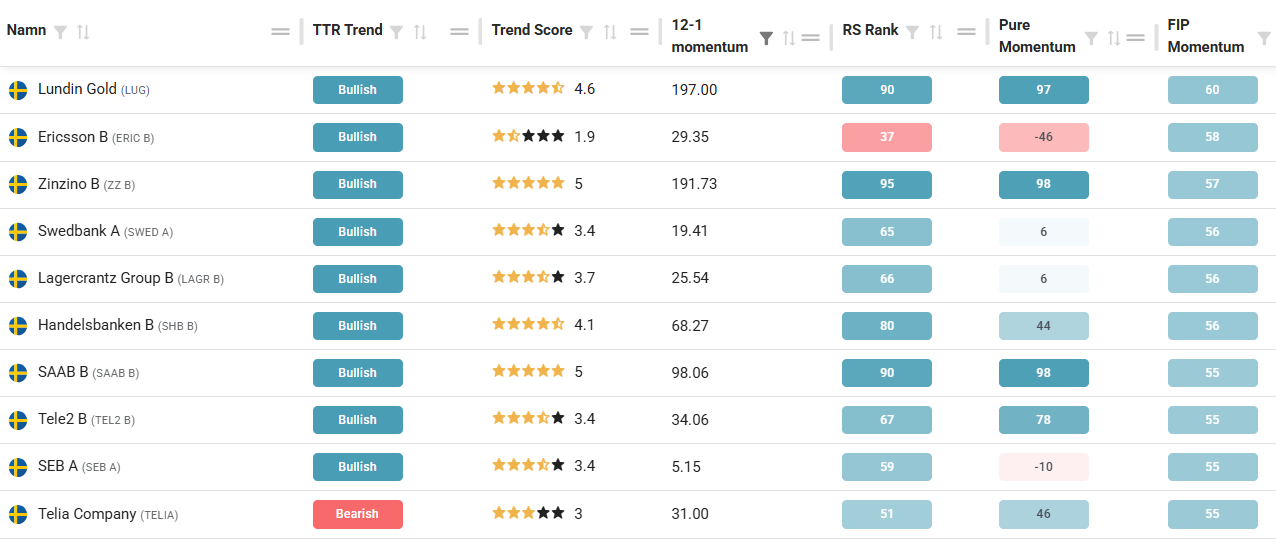
So how do you actually measure momentum and trend? On the analysis platform, we offer several different columns that all capture this phenomenon – albeit from slightly different angles. Regardless of which measure you choose, the purpose is the same: to find stocks that are in a positive movement.
In this post, we go through our most important metrics and how they differ, as well as how you as an investor can think in practice.

TTR Trend
What it measures: Medium-term trend direction – positive, neutral or negative – based on price, volume and volatility.
Why it's smart: TTR Trend is not a momentum measure in the classical sense, but a trend filter used in combination with, for example, short-term oversold signals. The filter's structure is similar to a 100-day moving average but is smarter: it also takes volume and volatility into account.
Trend rating
What it measures: An overall rating (1–5) for the price trend based on multiple time horizons – short, medium and long – with extra focus on the long-term trend driven by fundamentals. Also takes into account the number of days since the 52-week high. If the stock breaks to a new 52-week high, it has a positive impact on the trend rating.
Why it's smart: Many people focus too much on short-term movements, even though the most robust trends are long-term and often driven by fundamentals. Trend scores weigh different elements together and give you a clear indication of the underlying trend structure. Perfect for those who want a simple but powerful measure.
12-1 Momentum
What it measures: Price development over the last 12 months, excluding the last month.
Why it's smart: The last month often contains noise, rebounds, and occasional news. By excluding it, you get a cleaner signal that better captures the underlying trend. This metric is a classic in academic research and is often used in quantitative strategies.
RS Rank
What it measures: Relative return compared to other stocks, based on 3, 6, 9 and 12 months (greatest weighting in the last 3 months). Scale 1–100.
Why it's smart: RS Rank makes it easy to identify which stocks are currently among the strongest in the market. An RS Rank of 90 means that the stock has beaten 90% of the others – it doesn't get any clearer than that.
Pure Momentum
What it measures: The slope of an exponential regression line (i.e. trend) multiplied by R-squared (i.e. how “clean” the trend is). Values between -100 and 100. The calculation skips the last 10 days to provide a more stable and reliable measure of the underlying trend, without being affected by short-term movements that are often mean-reverting.
Why it's smart: This measure captures not only how much the price has risen, but also how evenly and steadily it has risen. A stock that has surged with high volatility will be worth less than one that has climbed steadily. For those of you who dislike wobbly graphs and want more stable trends, Pure Momentum is a powerful tool.
FIP Momentum
What it measures: Score for how smooth and gradual the uptrend has been without major price movements based on the percentage of positive days. FIP has a longer lookback period compared to Pure Momentum.
Why it's smart: Many investors react strongly to large movements, but often ignore the slow trends. FIP Momentum – inspired by the classic Frog in the Pan-study – highlights stocks where the uptrend has crept in. This can give an extra edge to trend strategies as the market tends to continue to underestimate these companies.
Overview: Our key metrics for trend and momentum
| Measure | Time horizon | Focus | Important detail | When it suits you best |
| TTR Trend | Medium length | Trend filter based on price, volume and volatility | Reacts smarter than moving average | As a filter in tactical strategies |
| Trend rating | Multiple (short, medium, long) | Overall rating of price development over time | Greatest emphasis on long-term trend | As an overall assessment |
| 12-1 Momentum | Long term (12 months, excl. latest) | Stable trend without short-term noise | Skipping the last month | For cleaner trend signal |
| RS Rank | Medium (3–12 months) | Relative strength against other stocks | Focus on the last quarter | To find the market leader |
| Pure Momentum | Medium (trend + smoothness) | Rewards consistent trends | Skipping the last two weeks | To filter out jerky stocks |
| FIP Momentum | Long term (trend + smoothness) | Gradual and steady rise | Avoids large movements | For slow, sustained trends |
Different time perspectives in momentum – why then?
Some metrics place more emphasis on the recent past (e.g. RS Rank), while others downplay it (e.g. 12-1 momentum) or focus on the long-term (e.g. trend rating).
It's not a logical error or contradiction. It's a conscious design choice.
Different measurements – different purposes
- RS Rank is a measure of current strength compared to other stocks. The purpose is to quickly identify which stocks are currently leading the market. Because market interest shifts quickly, we weight the last 3 months most heavily – that is often where the most recent information about a stock's relative strength is found.
- 12-1 momentum however, is used to isolate the underlying trend beyond temporary fluctuations. The past month is often full of noise – short-term news, rebounds, report reactions – which can destroy the quality of the signal. Excluding it gives a cleaner measure of lasting trend.
- Trend rating takes an even broader approach, weighing the long-term trend most heavily, but also taking into account the number of days since the last 52-week high. If the stock breaks out of a prolonged consolidation, it often has a positive impact on the rating. The idea here is that signals work best in line with a fundamentally driven trend – and it is more clearly visible over longer horizons.
Steady trends last longer – explosive movements often burn out.
Personally, I like smooth trends with a gradual and steady increase much more than explosive movements. It's not just a matter of taste – it's about risk, sustainability and psychology.
When a stock surges sharply in a short period of time, I get more nervous than enthusiastic. That kind of movement quickly attracts speculators, trigger-based algorithms, and short-term investors. It increases the risk of sudden jumps, overreactions, and quick reversals. To me, it feels more like getting on a speeding train – sure, it could go on for a while, but it could also derail at any moment.
Steady trends tend to be more stable. They often reflect a shift in fundamentals or a gradual increase in interest from long-term investors. No panic, no overreaction – just a steady direction. That kind of movement gives me much more confidence to hold the position through swings, and often the trend lasts longer than you think.
That's why I like metrics that take into account how the trend has been seen – not only How much it has gone up. Both Pure Momentum and FIP Momentum are examples of this. They help me find stocks where the path up has been as important as the result.
Strong trends that no one talks about are often the ones that last.
How should you think in practice?
All of these metrics aim to capture trends and momentum, but with different focuses. You don't have to choose a In fact, you get the best effect by combining several:
- Do you want simplicity? Use the Trend Rating as a quick overview.
- Do you want to find winners compared to the rest of the market? RS Rank is your friend.
- Do you want to capture qualitative trends? Look at Pure Momentum and FIP.
- Do you want to focus on historically proven strategy? Then 12-1 momentum is an excellent starting point.
For example, many strategies combine a 12-1 momentum threshold (above 20% or top 100) and then sort by FIP. This is exactly how our Pure Trend strategy is structured.
But never forget that even the best signal can go wrong. Momentum strategies require discipline, diversification and clear risk management. It is not the signals themselves that determine the outcome, but how you handle them over time.