Three seasonal cycles that affect the stock market – this is how we interpret them


Many investors look for patterns that can help them understand stock market movements. One of the more talked about phenomena is seasonal cycles – recurring patterns that have historically been shown to influence the market. But as with all other factors, there are no guarantees of future returns.
In our analysis, we use seasonal cycles as one of several building blocks in our decision-making. They serve as a context rather than a one-sided strategy – a tool to understand the historical tendencies of the market and how they may interact with other factors such as trend, macro and positioning.
In this post, we will go through three of the most famous seasonal cycles:
- 4-year presidential cycle – How the stock market tends to move during an American presidential term.
- 10-year decade cycle – Which years in a decade have been historically strong and weak.
- 1-year seasonal cycle – Recurring patterns throughout the year, such as “Sell in May” and strong final spurts in December.
By understanding these cycles, we can better put market movements into context and identify potential benefits – while always basing our decisions on robust strategies rather than individual signals.
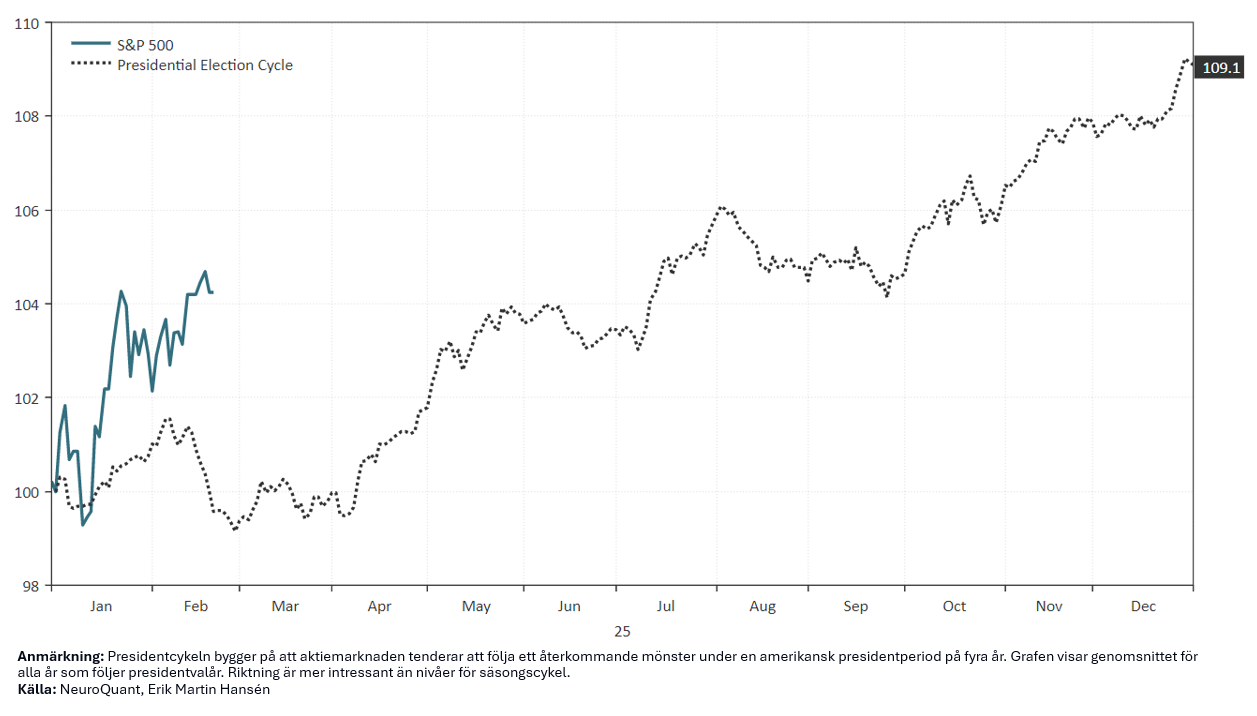
4-year presidential cycle
This cycle is based on the fact that the stock market tends to follow a recurring pattern during a four-year US presidential term. It is often divided into four phases:
- Year 1 (After election year): The first year after a presidential election is often marked by uncertainty as the new administration implements its policies. This uncertainty can lead to more subdued market performance.
- Year 2 (Mid-year elections): The second year, known as the midterm election year, has historically been the most volatile and weakest in the cycle. Political upheaval and preparations for midterm elections can contribute to this volatility.
- Year 3 (Pre-election year): The third year, the year before the presidential election, tends to be the strongest for the stock market. The administration can introduce economic stimulus to improve the economy ahead of the upcoming election, which often benefits the market.
- Year 4 (Election year): During the fourth year, the election year itself, the market can experience volatility due to uncertainty about the election results. Once the election is decided and uncertainty decreases, the market tends to stabilize and often develops positively.
The 2025 presidential cycle
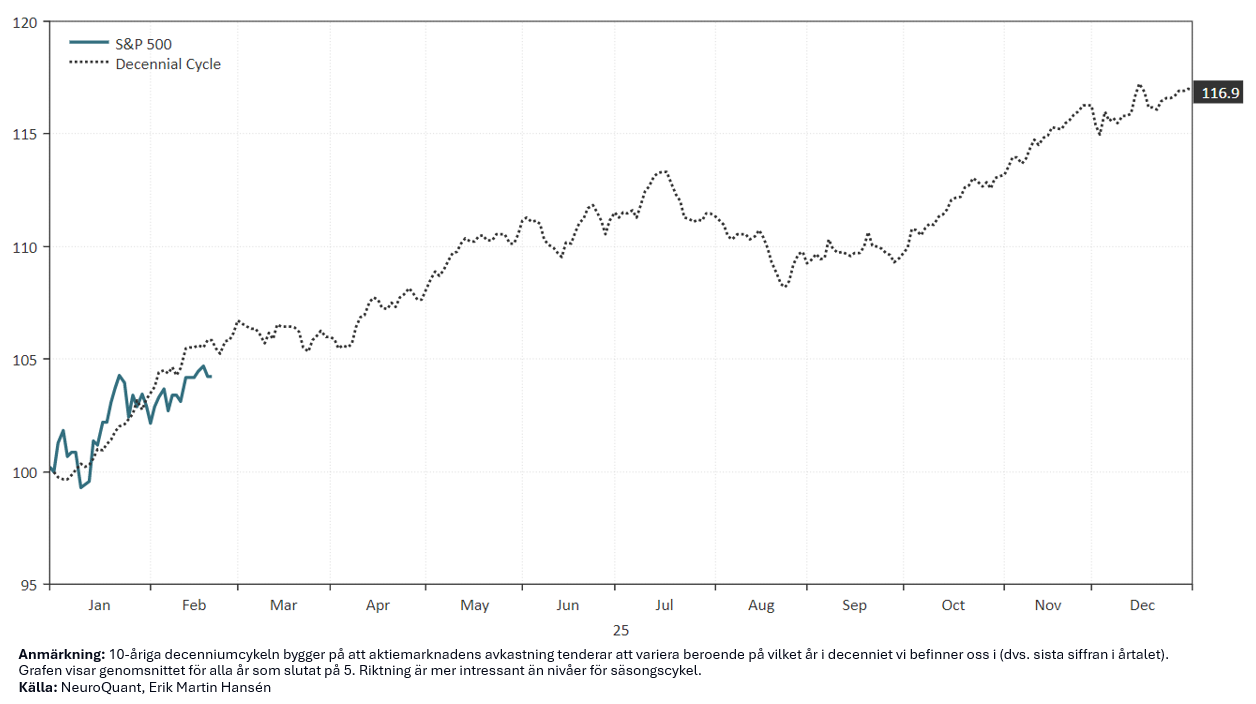
10-year decade cycle
This cycle is based on the fact that stock market returns tend to vary depending on which year of the decade we are in (i.e. the last digit of the year). It is based on historical statistics from the 19th century onwards.
- Years ending in 0: Has historically been weak, with several bear markets.
- Years ending in 1-3: Has often had mixed performance.
- Years ending in 5: Has been particularly strong, with few downturns.
- Years ending in 7: Have often been volatile and weak.
- Years ending in 9: Has tended to be good.
The most famous observation is that years ending in 5 have been extremely strong, while years ending in 0 and 7 often been weak.
The 2025 decade cycle
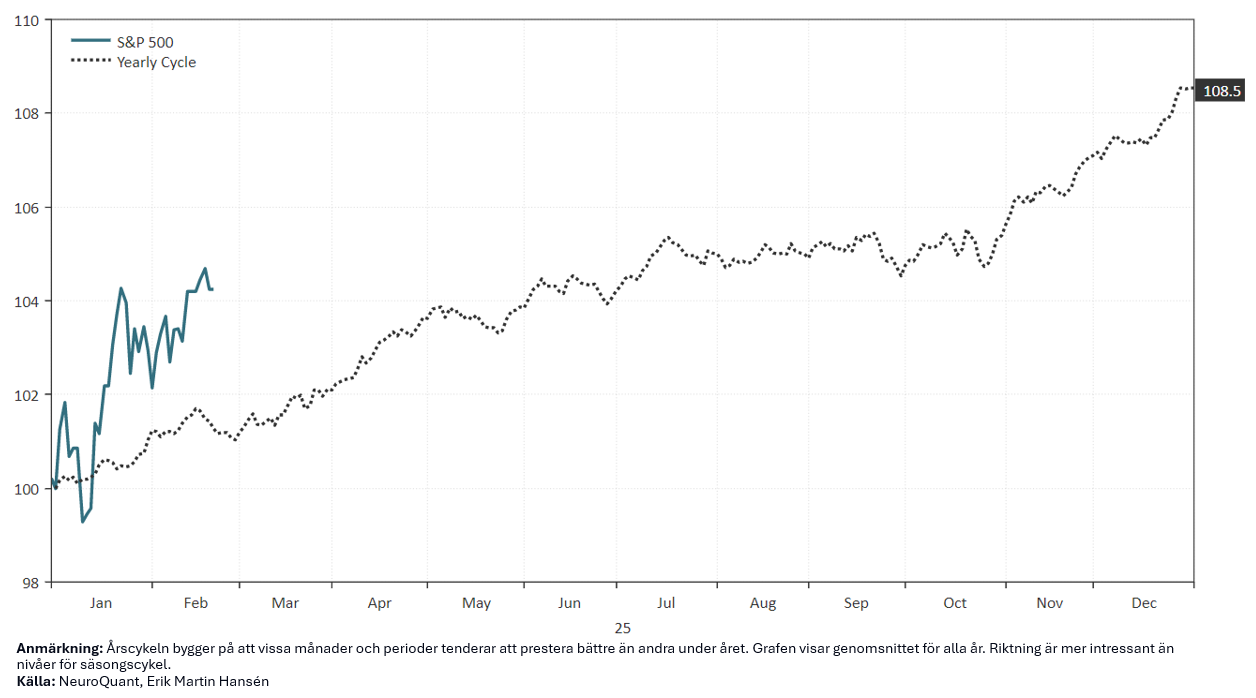
1-year seasonal cycle (annual cycle)
This cycle is based on the fact that certain months and periods tend to perform better than others during the year. The most well-known effects are:
- “Sell in May and Go Away”: May to October has historically been weaker than November to April.
- “Santa Claus Rally”: The stock market tends to be strong in the last weeks of December and early January.
- “January Effect”: Small companies tend to perform better in January than large companies.
- The September effect: September has historically been the weakest month of the year for stocks.
This cycle is often used by traders and investors to time short-term opportunities in the market.
The annual cycle for 2025
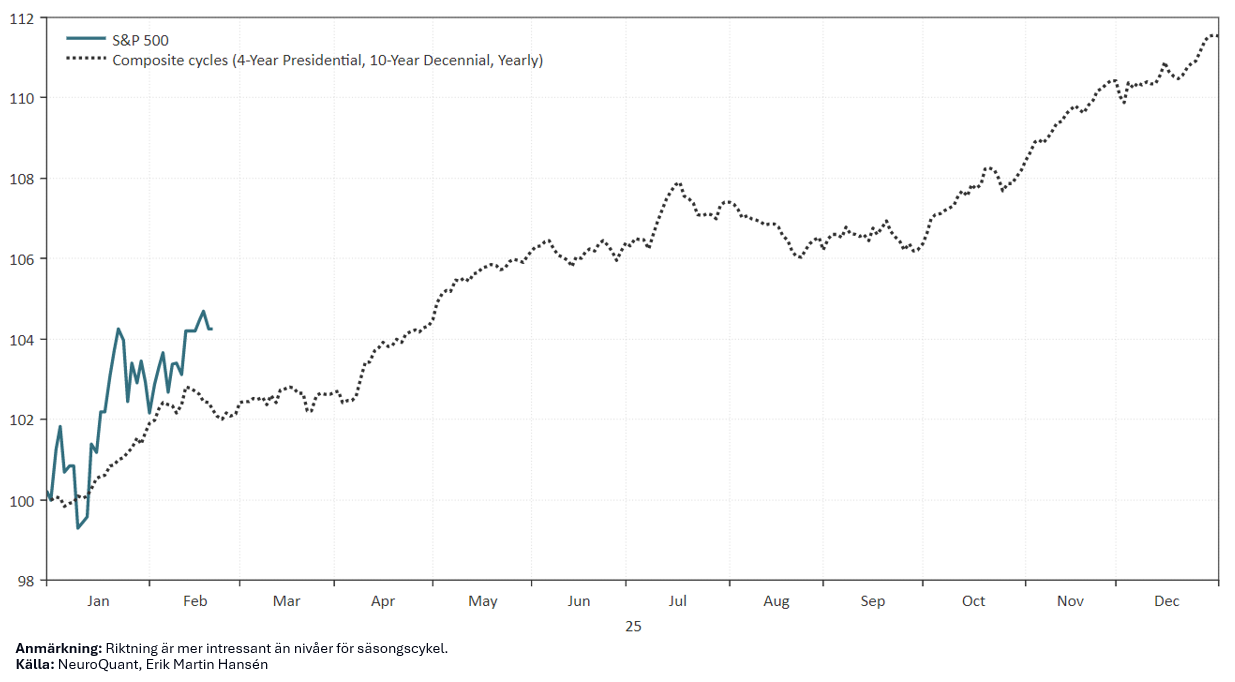
Combined effect of the three different cycles
Finally, we can illustrate the cycles with an average of the three different cycles.
Average of three different cycles
 Summary
The three seasonal cycles – the 4-year presidential cycle, the 10-year decade cycle and the 1-year seasonal cycle – show that the stock market has historically had recurring patterns due to political, economic and psychological factors. However, while these cycles can provide valuable context, they are never a sufficient basis for investment decisions on their own.
Historical patterns work best when put in the right context – along with trend, macro and positioning. By using seasonal cycles as part of a broader analysis, rather than as a stand-alone signal, we can increase our understanding of market dynamics.